
Doyuyo hosted 7 million guests in six months, how should restaurants use menu sales data?
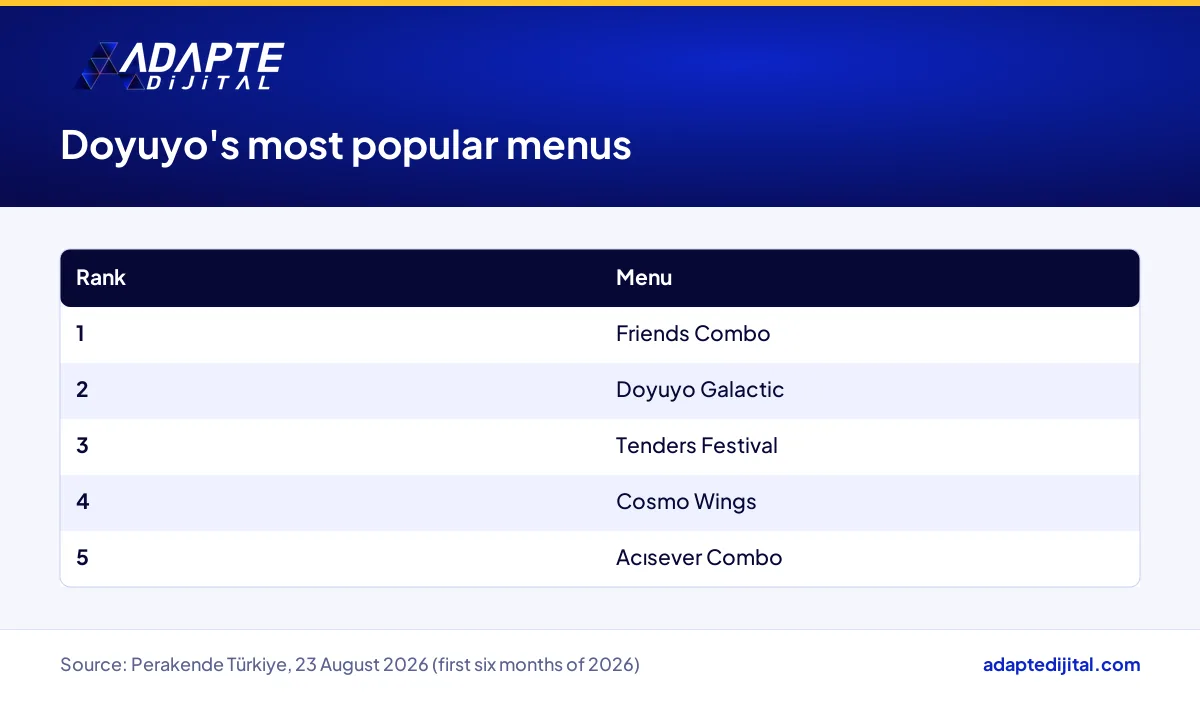
Restaurant chain Doyuyo says it hosted roughly 7 million guests in the first six months of 2026 and sold more than 8 million items over the same period (Perakende Türkiye, 23 August 2026). Its most popular menus were, in order, Friends Combo, Doyuyo Galactic, Tenders Festival, Cosmo Wings and Acısever Combo; among drinks, Strawberry Lemonade, Lemonade and Berry Hibiscus stood out.
For a restaurant owner, the real value lies in the ranking, not the volume. When a chain shares which menus lead its sales, it shows that you can pull the same list from your own till data and tie it to pricing, combo and promotion decisions. Every figure below comes with its source, and anything unclear is flagged as unclear.
What exactly do Doyuyo’s 7 million guests and 8 million items measure?
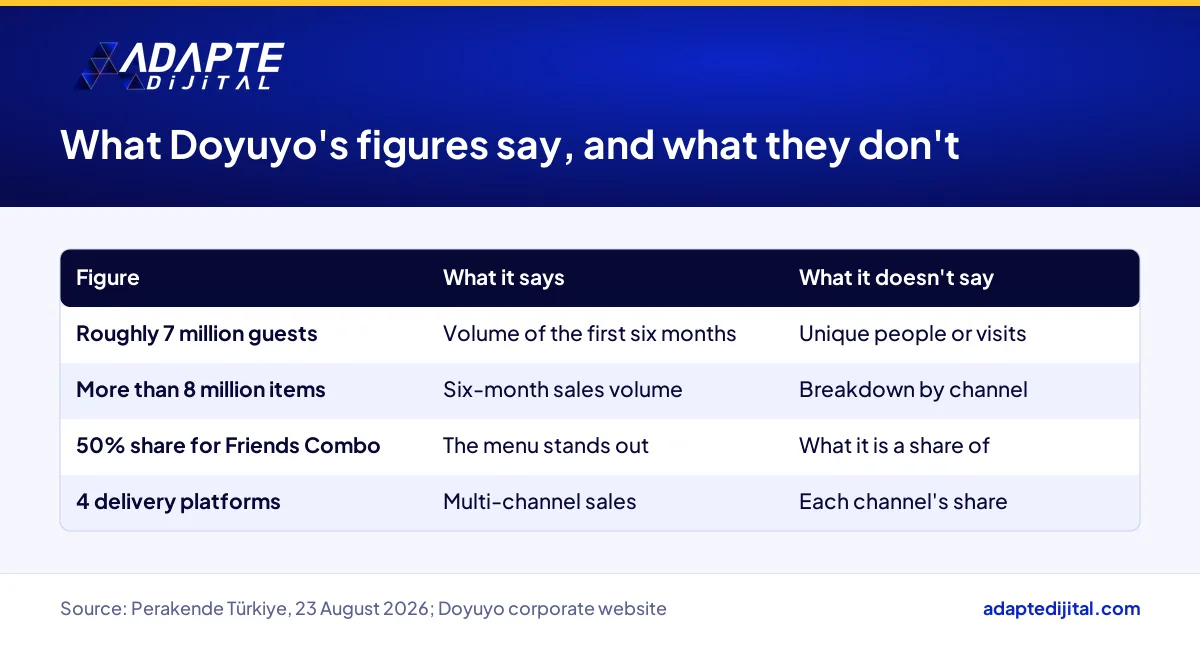
They measure total six-month volume, but the definition is not spelled out. The report does not say whether the 7 million “guests” are unique people or visits and transactions. It also does not say whether delivery orders are included. So the figure gives a sense of scale but cannot be used for per-unit analysis.
Which menus and drinks are most popular at Doyuyo?
Friends Combo tops the ranking, followed by Doyuyo Galactic, Tenders Festival, Cosmo Wings and Acısever Combo. Two of the top five menus have “combo” in their name. Among drinks, Strawberry Lemonade, Lemonade and Berry Hibiscus stand out; the report does not rank the drinks.
What do Doyuyo’s published figures tell a restaurant owner?
Four figures give you a frame for reading your own data. Each comes with a one-sentence comment from us. These comments are for business decisions; this is not investment advice.
- Roughly 7 million guests, first six months (Perakende Türkiye): A six-month period is also a sensible window for benchmarking your own sales data.
- More than 8 million items sold (Perakende Türkiye): Item volume means little on its own and only makes sense alongside a clear guest definition.
- A 50% share for Friends Combo (Perakende Türkiye): A percentage without a known base should not drive a decision.
- A 3,000 m² sauce production facility in Gebze Şekerpınar (Doyuyo corporate website): Menu consistency also depends on production set up outside the kitchen.
Who does using menu sales data affect in the restaurant sector, and how?
BU BÖLÜMÜN ÖZETİ
- Winning: the small restaurant that reads its data weekly
- Struggling: the neighbourhood restaurant with a long menu
- Indirectly affected: sauce, drink and packaging suppliers
In autumn 2026, among quick-service restaurants in Türkiye, the gap between those who read their data and those who do not keeps widening. The small restaurant that ties till data to menu decisions wins. The business with a long menu and data stuck on paper struggles. Suppliers and delivery platforms feel the effect indirectly.
Winning: the small restaurant that reads its data weekly
A business that spots which item is gathering dust on the menu, like stock sitting on a shelf, simplifies that line. The kitchen speeds up, stock items shrink and the till keeps ringing.
Struggling: the neighbourhood restaurant with a long menu
On a long menu, it is hard to see which items actually make money. Ingredients for the items that do not sell wait in the fridge and end up as waste.
Indirectly affected: sauce, drink and packaging suppliers
As restaurants trim their menus, they ask suppliers for fewer lines in larger volumes. For suppliers, that means shaping their range around the restaurant’s ranking. We interpret food service and retail data alongside the news agenda on our retail page.
Where does a restaurant collect menu data on the digital side?
From three places: the till system, the seller panels of delivery platforms and the digital menu. Each source answers a different question. Keeping all three under the same item names is the precondition for merging the data. We look separately at how infrastructure decisions affect sellers through Pazarama’s move to Google Cloud.
What should a restaurant owner do with menu data this week?
BU BÖLÜMÜN ÖZETİ
- List your top five for the last six months
- Read combos and single items separately
- Test a drink pairing
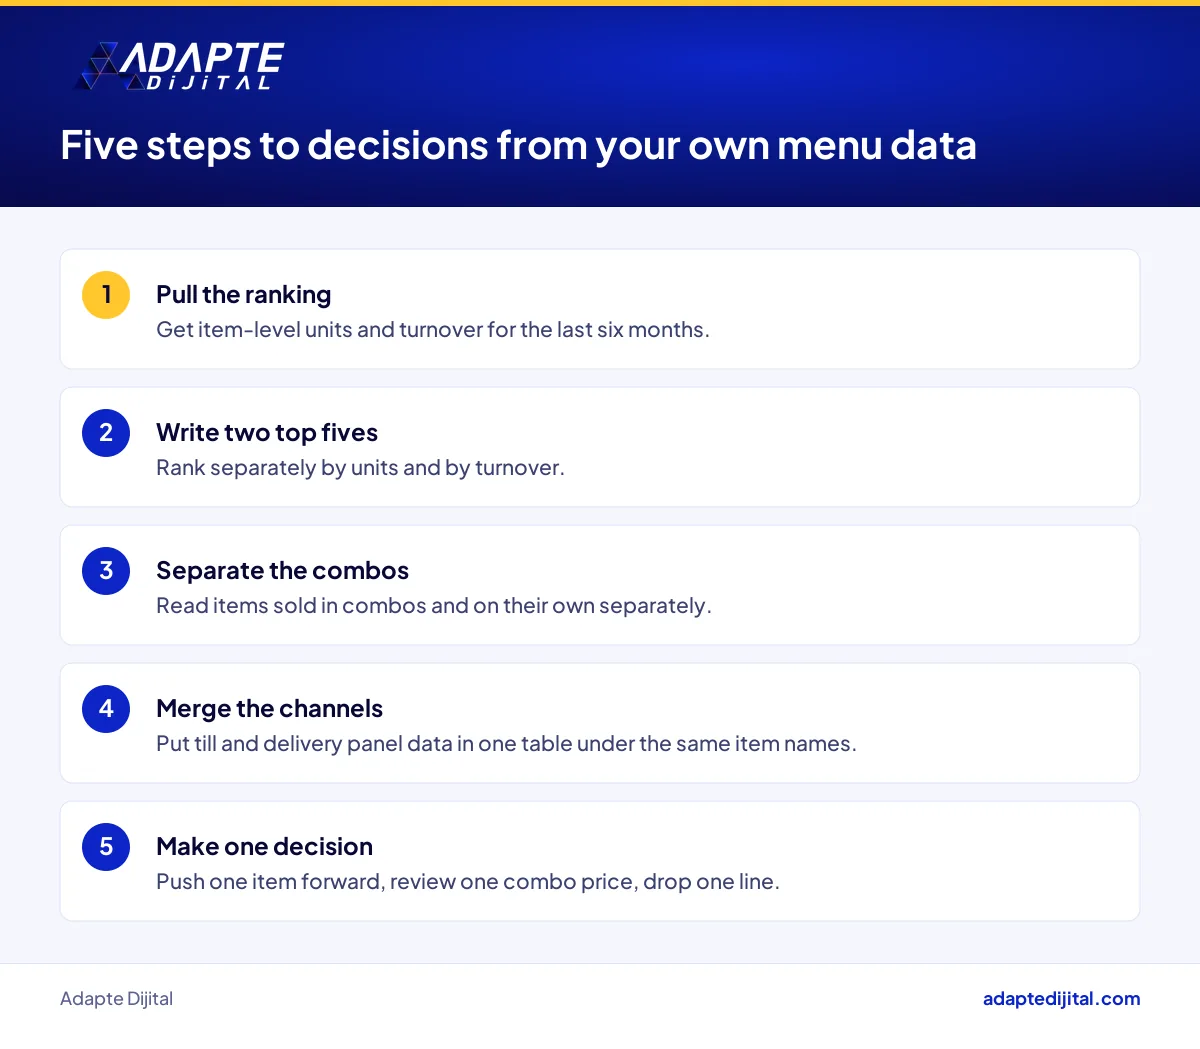
Pull the ranking for your own last six months and make three decisions: which item to push forward, which combo to reprice and which line to drop from the menu. We look at alternative models, such as pricing by weight, through Migros’s pay-by-weight restaurant.
List your top five for the last six months
Take item-level units and turnover from your till report. Write two separate top fives, one by units and one by turnover. The difference between the two lists reveals low-priced items that sell in high volume.
Read combos and single items separately
Separate items sold inside a combo from those sold on their own. That way you see whether the combo grows the basket or is simply a discount.
Test a drink pairing
Pair your best-selling menu with your best-selling drink as a fixed combination and track it for a month. We tie marketing and promotion decisions to data as part of our digital marketing services.
Quick Summary
- Doyuyo hosted roughly 7 million guests and sold more than 8 million items in the first six months of 2026 (Perakende Türkiye, 23 August 2026).
- Friends Combo is the most popular menu, followed by Doyuyo Galactic (Perakende Türkiye, 23 August 2026).
- The source does not say what Friends Combo’s 50% share is a share of.
- Doyuyo also takes orders through four delivery platforms (Doyuyo corporate website).
- A ranking pulled from your own till data is the firmest basis for pricing and combo decisions.
Short Glossary
- Combo menu
- A combo menu is the sales format used to bundle a main item, a side and a drink at a single price.
- Menu engineering
- Menu engineering is the method used to position items on a menu according to their sales volume and profitability.
- Average basket
- Average basket is the measure used to show the typical value of one order, found by dividing total turnover by the number of transactions.
Frequently Asked Questions
Next Step
If you would like to read your restaurant’s menu and sales data together, fill in our consult your expert form.
Sources: Perakende Türkiye, 23 August 2026 · Doyuyo corporate website, branch page
Updated: October 2026
Sık Sorulan Sorular
The source does not make that distinction. If the same person visits several times a month, the number of unique people could be far lower. Because of this gap, we do not calculate items or spend per guest.
The report gives no channel breakdown. According to Doyuyo’s corporate website, orders also come in through Migros Yemek, Yemeksepeti, Getir Yemek and Trendyol, four Turkish food delivery platforms. So the menu data may combine dining-room sales with those four platforms.
The report gives no branch count or list of cities. Branch figures in other publications contradict each other, and their dates cannot be seen. Calculating guests per branch from an undated number would mislead.
A combo is a menu that bundles a main item, a side and a drink at one price. A combo at the top of the list points to a sales structure in which bundling lifts the average basket. But the report does not separate combo sales from single-item sales.
The report mentions a 50% share for Friends Combo but does not say what it is a share of. Whether it means half of menu sales or half of combo sales is unknown. So it should not be read as “half of all sales”.
Two of the three drinks are lemonades. A drink is often sold inside or alongside a combo. The report has no data on which drink sells with which menu.
Even with definition gaps, a ranking gets relative position right. A percentage, on the other hand, is easily misread when its base is unknown. In your own reports, use the ranking first, then only percentages with a known base.
The report has no turnover, profitability or branch data. For someone considering a franchise or partnership, this announcement is a starting point, not an evaluation. An investment decision needs the company’s official, dated documents.
The corporate website adds one more piece of context: Doyuyo was set up by the PardoFood team, which is also behind the Carmelo Coffee brand. That tells you the chain sits within a group running more than one food and drink brand, but it says nothing about sales by brand.
Item, time, channel and combo component should each be recorded on a separate line. When a combo sells, you should also see which drink was inside it.
Check which item-level order figures your platform panel offers and download them every month. Put that report in the same table as your till data; the ranking for the dining room and for delivery may turn out different.
When customers find a restaurant in search, they look at the menu. The item at the top of your ranking should be visible on your profile and website; otherwise your best seller stays hidden in search.
The report gives no branch count. Branch figures in other publications contradict each other and are undated, so we do not give a current number.
That is not certain. The report mentions a 50% share but does not say what it is a share of.
It can start by pulling item-level units and turnover for the last six months from its till report. Writing separate top fives by units and by turnover gives the first decision.