
Website Statistics 2026: What Do the Numbers Say?

Website Statistics 2026 is one of those topics where good information saves both money and months. This updated 2026 guide brings the essentials together: what it is, how to plan it, how to execute it step by step, what it costs, which mistakes to avoid and how to grow it sustainably.
Understanding Website Statistics 2026: The Fundamentals 🛠️
This section covers the fundamentals of website statistics 2026 with field-tested guidance. For the broader framework, see our guide on Corporate Website vs. Social Media.
SECTION SUMMARY
- The Market Context
- First Principles
- What It Really Means
- Why It Matters in 2026
The Market Context
Website statistics are the most objective mirror showing where you stand in the digital world. It’s said that “websites are important”; but proving this with numbers is another matter. Research data collected in Turkey and globally in 2026 undeniably shows that a website is no longer an option, but a necessity. In this guide, we examine the real data of four critical areas, from conversion rates and trust research to mobile usage trends and search behavior.
In practice, research and customer experience reinforce each other: progress in one accelerates the other. Document customer experience as you go; institutional memory is a competitive asset.
First Principles
📊 According to Brightedge research, 68% of all digital traffic still passes through websites. Social media, advertising, and content platforms keep visitors temporarily; but the real platform that converts, builds trust, and makes customers permanent is the website.
The businesses that win treat planning as a system, not a one-off task. The gap between average and excellent pricing is usually discipline, not budget.
What It Really Means
This data is not accidental: It was compiled from reliable sources such as Google, HubSpot, Statista, Nielsen Norman Group, and Stanford Web Credibility Lab. Under each statistic, what it means and what your business should be doing today are clearly stated. Understanding website statistics is the first step in building your data-driven digital strategy.
A written standard for execution turns individual talent into repeatable results. Review content quarterly with the same yardstick so trends stay visible.
Why It Matters in 2026
Is your website getting visitors but not generating customers? When we examine website statistics and conversion data, the picture is striking: the industry average conversion rate is between 1–4%. But this average is a value calculated for both well-designed sites and those that are not optimized at all. Properly structured corporate websites easily achieve 3–5 times this average. Why is your competitor generating more customers from the same traffic? The answer lies in conversion optimization.
Without measurement, budgeting becomes opinion; with it, it becomes management. Pair the team with budgeting early; retrofitting them later always costs more.
Building Your Roadmap 📊
This section covers the planning layer of website statistics 2026 with field-tested guidance. For the broader framework, see our guide on First Impression.
SECTION SUMMARY
- Legal and Compliance Basics
- Building the Team
- Setting Clear Goals
- Research Before You Start
Legal and Compliance Basics
What do you lose when your site slows down by 1 second? According to Google’s 2024 benchmark report, when page load time increases from 1 second to 3 seconds, bounce rate increases by 32%. Amazon’s internal research shows that every 100 ms delay reduces revenue by 1%. For a site with an annual turnover of 1 million TL, this means 10,000 TL/delay. The return on investment in speed is that tangible.
Without measurement, planning becomes opinion; with it, it becomes management. Pair pricing with planning early; retrofitting them later always costs more.
Building the Team
- 1 → 3 sec delay: bounce rate increases by 32% (Google, 2024)
- Every 100 ms delay: 1% revenue loss (Amazon internal research)
- Mobile 3-second threshold: 53% of visitors leave the page (Google)
- 1-second speed increase: conversion rate increases by an average of 7% (Portent, 2023)
Start small with execution, validate with data, then scale what works. Treat content as an investment line, not an expense line, and manage it accordingly.
Setting Clear Goals
Color, text, or positioning — which converts more? According to HubSpot’s A/B testing of 300,000 pages, personalized CTAs generate 202% more conversions than generic CTAs. Buttons using action verbs (“Get a Quote” vs “Submit”) increase conversion by 18–25%. CTAs positioned above the fold are 47% more effective than those in the middle of the page. This data shows that it’s the strategy, not the design, that converts.
Consistency beats intensity: a steady rhythm in budgeting outperforms sporadic bursts. What gets scheduled gets done: put the team on the calendar, not the wish list.
Research Before You Start
- Personalized CTA: +202% conversion (HubSpot, 300K page A/B test)
- Action button: +18–25% clicks (“Try for Free” vs “Submit”)
- Above the fold CTA: +47% conversion (with the middle of the page) (comparison)
- CTA supported by video: +80% conversion (Wyzowl, 2024)
Every decision about measurement should answer one question: does it serve the customer? Customer feedback is the cheapest consultant visibility will ever have.
Step-by-Step Implementation 🔍
This section covers the execution layer of website statistics 2026 with field-tested guidance. For the broader framework, see our guide on Having a Digital Presence.
SECTION SUMMARY
- Solid Digital Foundation
- Workflow Discipline
- Getting Started Right
- Tools and Infrastructure
Solid Digital Foundation
- Live chat: +48% revenue per visitor (Forrester)
- Chatbot: solves 80% of customer questions without human support (IBM)
- Response time <1 min: 391% higher conversion rate (Lead Connect, 2024)
- WhatsApp integration: 89% messaging penetration in Türkiye — the most effective instant channel
Every decision about execution should answer one question: does it serve the customer? Customer feedback is the cheapest consultant content will ever have.
Whatever your niche, discoverability starts with technical health: fast pages, clean structure and content that machines can parse. Align your site with Google’s current search documentation so that every other investment on this list can actually be found.
Workflow Discipline
📊 Infographic suggestion: “Conversion Rate Comparison by Sector 2026” — Visualize the E-commerce / Service / B2B / Local business segments with a horizontal bar graph.
Document budgeting as you go; institutional memory is a competitive asset. Digital tools amplify the team; they never replace the thinking behind it.
Getting Started Right
When your visitor arrives at your site, they are looking for an answer to the question “Is this trustworthy?” in the first 5 seconds. Stanford Web Credibility Lab’s research, updated for a decade, reveals that users assess a company’s credibility 75% by looking at its website. If the website is non-existent or poorly designed, and your competitor has a good one — the decision is already made. These figures send a very clear message to businesses about trust.
The gap between average and excellent measurement is usually discipline, not budget. A ninety-day plan turns visibility from ambition into an operating routine.
Tools and Infrastructure
🏆 Nielsen Norman Group’s 2024 user behavior research shows that visitors spend only 10–20 seconds searching for trust signals. SSL certificates, professional design, testimonials, and contact information — each of these affects the trust score. In light of this data, making investment decisions is no longer based on guesswork, but on data.
Review growth quarterly with the same yardstick so trends stay visible. In practice, operations and growth reinforce each other: progress in one accelerates the other.
Investment and Resource Planning 🧭
This section covers the financial side of website statistics 2026 with field-tested guidance. For the broader framework, see our guide on Why Does a Cheap Website End Up Costly.
SECTION SUMMARY
- Funding Options
- Hidden Cost Items
- Startup Cost Breakdown
- Ongoing Expenses
Funding Options
- 50 ms: visual trustworthiness assessment time (University of Missouri)
- 94%: percentage of visitors who found the content unsafe and did not read it due to poor design
- 38%: percentage of users who left an unattractive website (Adobe, 2023)
- 57%: Percentage of users who trust the brand due to professional design
Review budgeting quarterly with the same yardstick so trends stay visible. In practice, the team and budgeting reinforce each other: progress in one accelerates the other.
Hidden Cost Items
Does the lock icon in the address bar really make a difference? According to GlobalSign’s 2024 research, 85% of users refuse to shop from unsafe sites. The same study shows that 82% of users who see a “Not Secure” warning leave the page immediately. Considering that 31% of e-commerce sites in Türkiye still display SSL warnings, this difference directly translates into a competitive advantage.
Pair measurement with visibility early; retrofitting them later always costs more. The businesses that win treat visibility as a system, not a one-off task.
Startup Cost Breakdown
- 85%: Percentage of users who refuse to shop from an insecure site (GlobalSign, 2024)
- 82%: Percentage of users who leave the page when faced with a “Not Secure” warning
- 31%: Percentage of sites in Türkiye displaying SSL warnings (Sucuri, 2024)
- A+ SSL rating: average 15% increase in conversion rate (SSL Labs data)
Treat growth as an investment line, not an expense line, and manage it accordingly. A written standard for operations turns individual talent into repeatable results.
Ongoing Expenses
How trustworthy is a site without customer reviews? According to BrightLocal’s 2025 survey, 87% of consumers research local businesses online before making a purchase. The same study reveals that businesses with 4 stars and above ratings receive 94% more clicks. This research shows that social proof has a much more measurable impact than advertising budget.
What gets scheduled gets done: put research on the calendar, not the wish list. Without measurement, customer experience becomes opinion; with it, it becomes management.
Common Mistakes to Avoid ⚠️
This section covers the risk side of website statistics 2026 with field-tested guidance. For the broader framework, see our guide on Website Health Check.
SECTION SUMMARY
- Going It Alone
- Chasing Trends Blindly
- The Most Expensive Mistake
- Skipping the Research Phase
Going It Alone
- 52%: Percentage of users visiting the “About Us” page (KoMarketing)
- +34%: Increased trust in the “About Us” page containing a team photo and mission
- +27%: with visible address and phone numberIncrease in form completion rate
- 68%: Percentage of visitors leaving the site without contact information
What gets scheduled gets done: put measurement on the calendar, not the wish list. Without measurement, visibility becomes opinion; with it, it becomes management.
Chasing Trends Blindly
🏆 Infographic suggestion: “Trust Signals and Conversion Impact” — A vertical infographic showing the impact of SSL, social proof, design quality, and contact information on conversion with percentage increases.
Customer feedback is the cheapest consultant growth will ever have. Start small with operations, validate with data, then scale what works.
The Most Expensive Mistake
How many of your site visitors are phone users — and how much do these users buy? The mobile category of website statistics has undergone a revolutionary transformation in the last three years. According to Statista’s 2026 report, 58.3% of global web traffic comes from mobile devices. In Türkiye, this rate is over 72%. Google has been implementing mobile-first indexing since 2019: it evaluates your site from a mobile perspective first, then ranks it. Website statistics proves mobile priority in a numerical way.
Digital tools amplify research; they never replace the thinking behind it. Consistency beats intensity: a steady rhythm in customer experience outperforms sporadic bursts.
Skipping the Research Phase
📱 Mobile users are not just browsing; they are now buying, filling out forms, and searching. According to Salesforce’s 2025 research, mobile e-commerce transactions have reached 72.9% of all online sales. This data has moved mobile optimization from the “good if it’s nice” category to the necessity category. 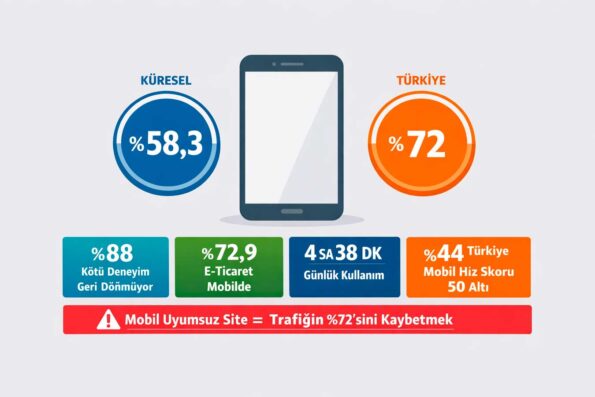
A ninety-day plan turns planning from ambition into an operating routine. Every decision about pricing should answer one question: does it serve the customer?
Scaling and Long-Term Success 🚀
This section covers the growth layer of website statistics 2026 with field-tested guidance. For the broader framework, see our guide on What kind of A website for the manufacturing sector hav.
SECTION SUMMARY
- Continuous Improvement
- Working With Experts
- Measuring What Matters
- Building Repeat Business
Continuous Improvement
How many customers does a mobile-incompatible site lose? According to Google’s 2024 “Mobile Experience” report, 88% of users never return to that site after a bad mobile experience. The same report reveals that mobile pages have a 15% lower conversion rate compared to desktop — a difference that can be closed through optimization. 44% of e-commerce sites in Türkiye have a mobile speed score below 50 (Google PageSpeed). A ninety-day plan turns growth from ambition into an operating routine. Every decision about operations should answer one question: does it serve the customer? Why do non-mobile sites fall behind in Google rankings? Since 2019, Google has been indexing the mobile version first. According to Ahrefs’ 2025 big data analysis, non-mobile sites experience an average 42% drop in organic traffic. Website statistics This is the most critical fact in the SEO category: good content becomes invisible when combined with a poor mobile experience. Mobile-first indexing is no longer a technical necessity for corporate websites, it’s a condition of existence. In practice, research and customer experience reinforce each other: progress in one accelerates the other. Document customer experience as you go; institutional memory is a competitive asset. The businesses that win treat planning as a system, not a one-off task. The gap between average and excellent pricing is usually discipline, not budget. Is shopping on phones really happening, or are they switching to desktops? According to Salesforce’s 2025 Commerce Cloud report, mobile e-commerce transactions have reached 72.9% of all online sales. In Türkiye, Mastercard’s 2025 consumer research reveals that 61% of online purchases will be completed via telephone. Sites without mobile payment integration cannot access a large portion of this market. A written standard for execution turns individual talent into repeatable results. Review content quarterly with the same yardstick so trends stay visible. 📈 According to Forrester Research’s 2025 report, companies that invest in user experience achieve a return on investment of up to 400%. The same report reveals that a 1% increase in conversion rate, the most critical indicator of website statistics, is as valuable as doubling your advertising budget. This clearly demonstrates how powerful a leverage optimization is. Website statistics speaks for itself on this matter. Each sector has a different conversion rate — so what is the benchmark for your sector? E-commerce sites operate with an average conversion rate of 1.5–3%. The service sector (law, accounting, consulting) receives form requests between 3–8%. In the B2B software and SaaS categories, the demo request rate hovers around 1–2%, and the value of each conversion is very high. You can’t optimize without knowing your own ratio. What happens when a visitor’s question isn’t answered instantly? Website statistics paint a striking picture here: According to Forrester, sites using live chat increase revenue per visitor by 48%. Salesforce research reveals that 64% of customers expect immediate responses to their problems. Corporate websites without a WhatsApp button or live chat are missing this opportunity every day. How long does it take for a first impression to form? According to research from the University of Missouri, people evaluate the visual appeal of websites in just 50 milliseconds. This occurs before the eyes even begin scanning the page. The same research reveals that poor design causes 94% of visitors to reject the site without even looking at the content. Design is more than aesthetics: architecture of trust. Where does Turkey stand in global mobile usage? According to the RTÜK 2025 Digital Turkey Report, 87% of internet users in Türkiye connect via smartphone. The average daily mobile internet usage is 4 hours and 38 minutes — above the world average. 43% of this time is spent on information searching and commercial activities. If your site is not mobile-friendly, this entire audience goes to your competitor. 📱 Infographic suggestion: “Turkey Mobile Usage Map 2026” — combine traffic share, daily usage time, e-commerce rate, and mobile incompatibility costs in a single visual area. Who is the visitor buying from — the product or the person behind it? According to KoMarketing’s research, 52% of users
Working With Experts
Measuring What Matters
Building Repeat Business
1.1 Average Conversion Rates by Sector
To wrap up: treat website statistics 2026 as a system with a rhythm — audit where you stand, write the plan, execute in ninety-day cycles and measure with the same yardstick every month. That quiet discipline, more than any single tactic, is what separates lasting businesses from short-lived attempts. 🚀