
Mall turnover index rose 25.2% in July, what should store owners do as real sales fall?
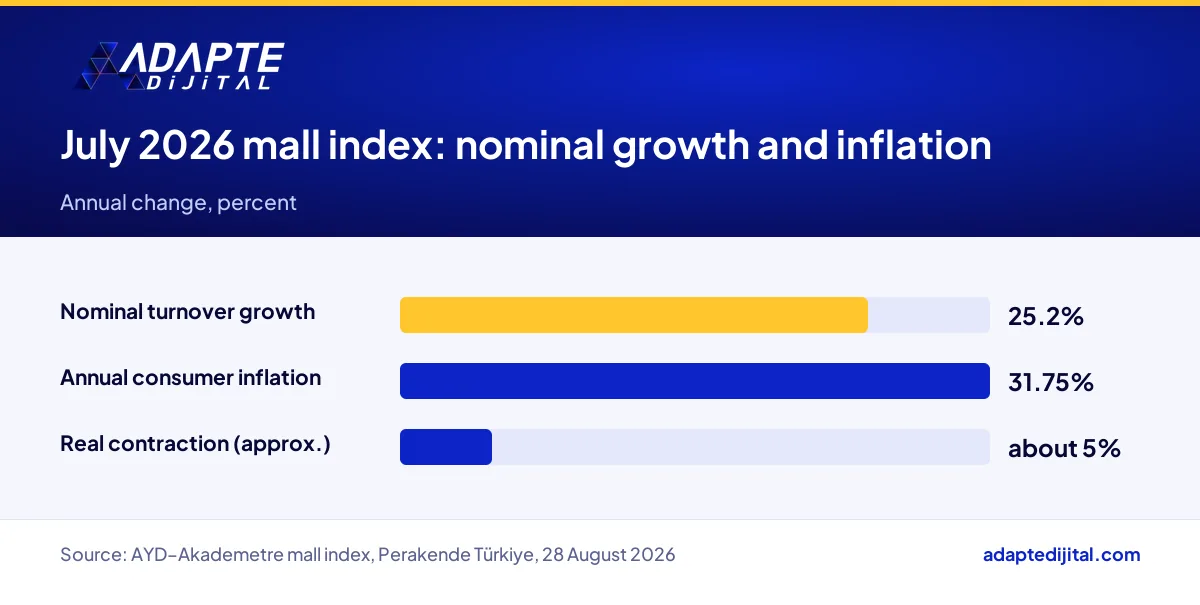
Türkiye’s AYD–Akademetre mall turnover index rose 25.2% year on year in nominal terms in July 2026 and stood at 5,169 points; with annual consumer inflation at 31.75%, turnover per square meter shrank by about 5% in real terms (Perakende Türkiye, 28 August 2026). Read together with the June and August data, the data show three consecutive months of real decline in malls.
Here is what that means for you: the lira in your till is growing, but it covers less stock, rent and payroll than it did a year ago. If you run a store in a Turkish AVM (the local term for a shopping mall), the summer 2026 data make your first job clear: put your own revenue on the same scale as inflation and make decisions on the real number.
Why does Türkiye’s mall turnover index rise in July 2026 but fall in real terms?
Because turnover rose 25.2% in lira while prices rose 31.75%. The index is compiled by AYD (Alışveriş Merkezleri ve Yatırımcıları Derneği, the Shopping Centers and Investors Association) with Akademetre Research, and it measures turnover per square meter. Economist Fatih Keresteci sums up the gap: “This ratio points to a real contraction of 5%.”
How does a mall store owner calculate their own real revenue?
With three numbers: this month’s revenue, revenue in the same month last year, and annual inflation. The formula is (this month ÷ same month last year) ÷ (1 + annual inflation) − 1. Applied to the July index, 1.252 ÷ 1.3175 comes to about 0.95, a real decline of about 5%. You run the same one-line calculation every month with your own figures.
Which businesses does the three-month real decline in Turkish malls hit, and how?
BU BÖLÜMÜN ÖZETİ
- Under pressure: hypermarkets, footwear and clothing
- Relatively strong: entertainment, technology and cosmetics
- Indirectly affected: mall management and tenant mix
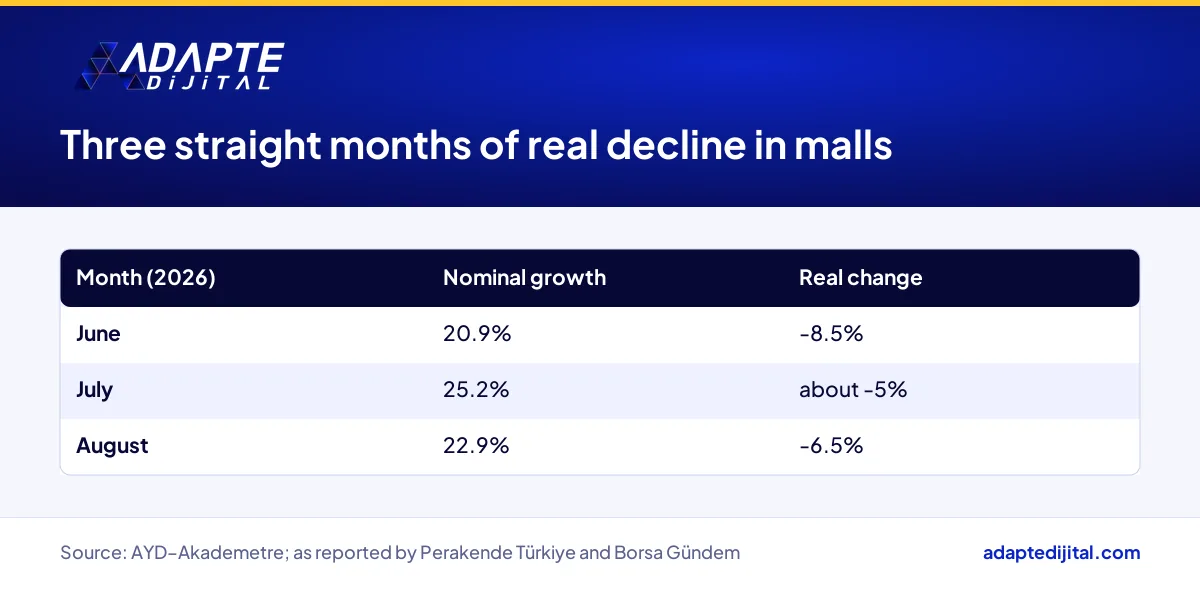
Real turnover fell 8.5% in June, about 5% in July and 6.5% in August (Borsa Gündem; Perakende Türkiye). Keresteci linked June’s weakness to the timing of Ramadan and to purchasing power. The impact is not the same in every category, and the August breakdown shows who is under pressure.
Under pressure: hypermarkets, footwear and clothing
In August, hypermarkets rose 11.7%, footwear 9.6% and clothing 24.4% in nominal terms, all below 31.51% inflation (Borsa Gündem). In these stores the average basket can shrink while more stock ends up sitting on the shelf until markdown. We look at turning stock into cash in this climate through Koton’s first-half figures.
Relatively strong: entertainment, technology and cosmetics
In the same month, entertainment and hobby rose 78%, technology 38.1% and personal care and cosmetics 32% (Borsa Gündem). These categories stay above inflation. Food and beverage, at 27.7%, sits just below the threshold.
Indirectly affected: mall management and tenant mix
Where rent is linked to turnover, a real fall in sales per square meter also means a real fall in rental income. Mall management may want to shift the tenant mix toward stronger categories. That narrows the bargaining power of tenants in the weaker ones.
What does the real decline in Turkish malls change on a store’s digital side?
It makes the gap between visits and spending visible. In August, mall footfall rose 2.12% year on year while turnover fell 6.5% in real terms (Borsa Gündem). More people walk through the doors, but their spending does not keep pace with prices. The job of the digital side is to reach that shopper before the visit and bring them back afterward.
How should a store owner read a mall lease during a real decline?
Put the rent line on the same scale as your revenue. Turkish malls fall under Law 6585 on the Regulation of Retail Trade and the Shopping Malls Regulation published in the Official Gazette on 26 February 2016; the framework is set out on the Ministry of Trade’s shopping malls page. Verify with the official source; this is not legal or financial advice.
The most common mistake: taking nominal growth for real growth
When revenue is up 25.2% on last year, as the July index was, it is tempting to scale up orders and staff. With inflation at 31.75%, that is shrinkage. The feeling that the till isn’t turning comes straight from this mistake.
What should a store owner with a mall location do this week?
Build one table this week and fill in the last three months. For June, July and August, compare your own nominal growth with that month’s inflation. If you are below the threshold in all three, revisit your stock, rent and advertising decisions using the real number.
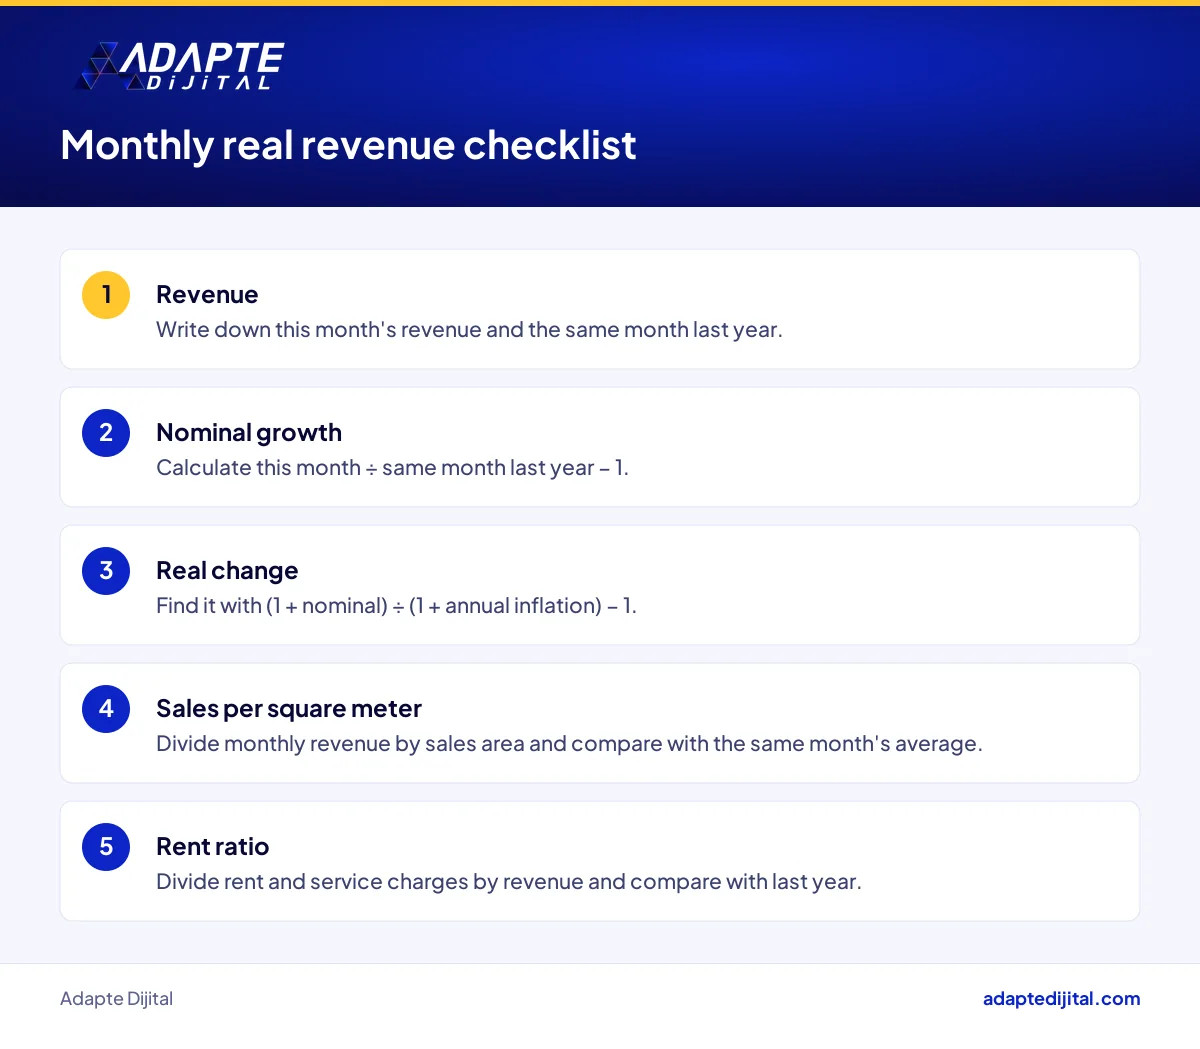
- This month’s revenue and revenue in the same month last year
- Nominal growth = this month ÷ same month last year − 1
- Real change = (1 + nominal growth) ÷ (1 + annual inflation) − 1
- Sales per square meter = monthly revenue ÷ sales area, compared with the August 2026 national average of TL 20,554
- Rent ratio = (rent + service charges) ÷ monthly revenue, compared with the same month last year
Quick Summary
- The mall turnover index rose 25.2% in nominal terms in July 2026 and stood at 5,169 points (Perakende Türkiye).
- With annual inflation at 31.75%, the real contraction is about 5% (Perakende Türkiye).
- With real declines of 8.5% in June and 6.5% in August, malls show three straight months of real loss (Borsa Gündem).
- In August, clothing, footwear and hypermarkets stay below inflation, while entertainment and technology stay above it (Borsa Gündem).
- A store owner should calculate revenue every month against the same month last year and that month’s inflation.
Short Glossary
- Real turnover
- Real turnover is the measure used to show nominal turnover adjusted for inflation.
- Sales per square meter
- Sales per square meter is the productivity measure used to show how much turnover each square meter of sales area generates.
- Tenant mix
- Tenant mix is the management term used to describe the category and brand distribution of stores in a mall.
Frequently Asked Questions
Next Step
If you would like to build your own real revenue table with us, fill in the consult your expert form and we will get back to you.
Sources: Perakende Türkiye, 28 August 2026 · AYD–Akademetre Research mall index · Borsa Gündem (reports on the June and August 2026 index) · Republic of Türkiye Ministry of Trade, Shopping Malls
Updated: October 2026
Sık Sorulan Sorular
Nominal turnover is the lira that comes into the till. Real turnover is the same lira adjusted for inflation, and it shows how much stock and service that money actually buys. If inflation runs ahead of nominal growth, the till looks full while the business shrinks.
The July report has no category, Istanbul versus Anatolia, or footfall breakdown. The “about 5%” is also a rounded figure. If you want to compare categories, use the August data and don’t attribute it to July.
July’s 5,169 points sits below June’s 5,249 and August’s 5,392 (Borsa Gündem). The score moves from month to month. What matters is the gap between annual nominal growth and inflation.
Compare July with last July, not with June. Holidays, school calendars and sales seasons shift from month to month, and a year-on-year comparison reduces that noise.
The threshold is 31.75% for July, 31.51% for August and 32.11% for June (Perakende Türkiye; Borsa Gündem). If your nominal growth is below that month’s threshold, you are shrinking in real terms. The report does not say which CPI series the 31.75% refers to, so base your own calculation on the bulletin from TÜİK, Türkiye’s statistics institute.
The index measures turnover per square meter, so use the same yardstick: monthly revenue ÷ sales area. In August 2026 the national average was TL 20,554, with Istanbul at TL 23,983 and Anatolia at TL 18,269 (Borsa Gündem). Compare these August figures with your own August, not with July.
Check three things on your Google Business Profile once a week: opening hours, floor information and current product photos. A shopper who searches “near me” before heading to the mall should find accurate details and the products you really have in stock. We cover the in-store and on-screen side of standing out on the shelf in Atelier Rebul’s Sephora plan.
Measure ad spend by the customers who reach the store and the till, not by clicks. Set up the monthly calculation this way: sales from ads ÷ ad spend. If that ratio is lower than in the same month last year, change the targeting, not the budget.
Add monthly rent and service charges, then divide by monthly revenue. If that ratio is higher than in the same month last year, rent is rising faster than your real revenue. Take those two numbers to the negotiating table.
Fill in the five lines below every month when the index comes out. This one-page table gives you the single number to discuss at the Monday meeting.
First the stock sitting on the shelf, then ad targeting, and rent last. Stock turns into cash fastest, while a rent negotiation takes time. We build this table together with your digital channel data through our digital consulting service.
The index comes out every month, and we explain what it means in a store owner’s language on our retail page. Put your own table next to that data each month.
If your revenue growth is below inflation, the same lira covers less stock, rent and payroll. In July 2026 the threshold was 31.75%, and growth below it is a real decline.
The July report has no category breakdown. For category comparisons, use the August 2026 data and don’t attribute it to July.
Asking is a matter of negotiation; whether it is a right depends on your contract. Calculate your rent ratio and read the contract with a lawyer.