
ŞOK Marketler hits 167.8 billion TL in first-half sales, does more revenue mean profit?
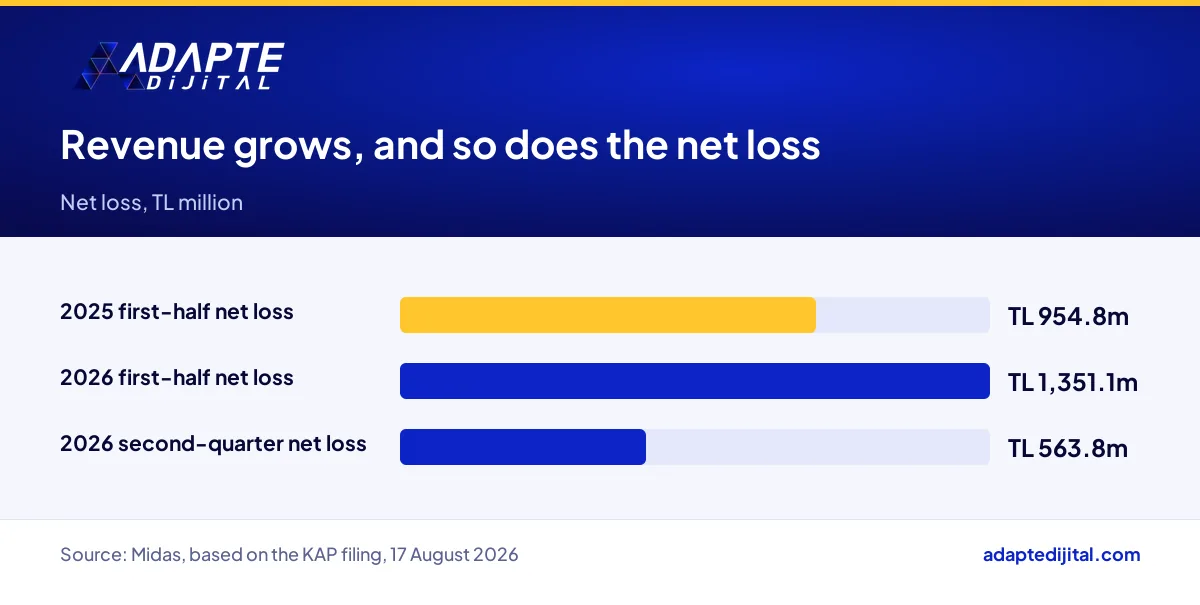
ŞOK Marketler, one of Türkiye’s discount grocery chains, reached TL 167.8 billion in revenue in the first six months of 2026, with sales up 7% in real terms; it runs 11,175 stores and employs 52,790 people (Perakende.org, 18 August 2026). Over the same period, the company’s first-half net loss came to about TL 1.35 billion, according to KAP data reported by Midas; KAP is Türkiye’s public disclosure platform. A year earlier, the first-half loss was TL 954.8 million.
What it means for you: revenue can grow while losses grow too. For a small grocery, café or shop owner, the lesson is the same: a busy till does not mean money left in your pocket. This is not investment advice and contains no stock commentary.
What do ŞOK Marketler’s first-half revenue and loss say together?
Revenue and the bottom line move in opposite directions. Sales rise 7% in real terms, while the first-half net loss climbs to TL 1,351,115,156, according to KAP data reported by Midas. The loss in the same period last year was TL 954.8 million, and the second quarter alone shows a loss of TL 563.8 million. The growth is real, but it does not reach the profit line.
Why isn’t ŞOK Marketler’s 7% real growth a profit signal on its own?
Because growth measures sales volume, while profit measures what is left after sales. As a store network grows, rent, staff and investment costs grow with it. The story also does not say which inflation measure the real increase is based on. Interim lines such as EBITDA and gross margin are not in our sources, so we do not interpret them here.
Which calculation lets a small retailer separate growth from profit like ŞOK’s?
BU BÖLÜMÜN ÖZETİ
- Step 1: Calculate real growth
- Step 2: Find revenue per store
- Step 3: Put gross profit in the same table as revenue
- Most common mistake: Taking revenue for profit
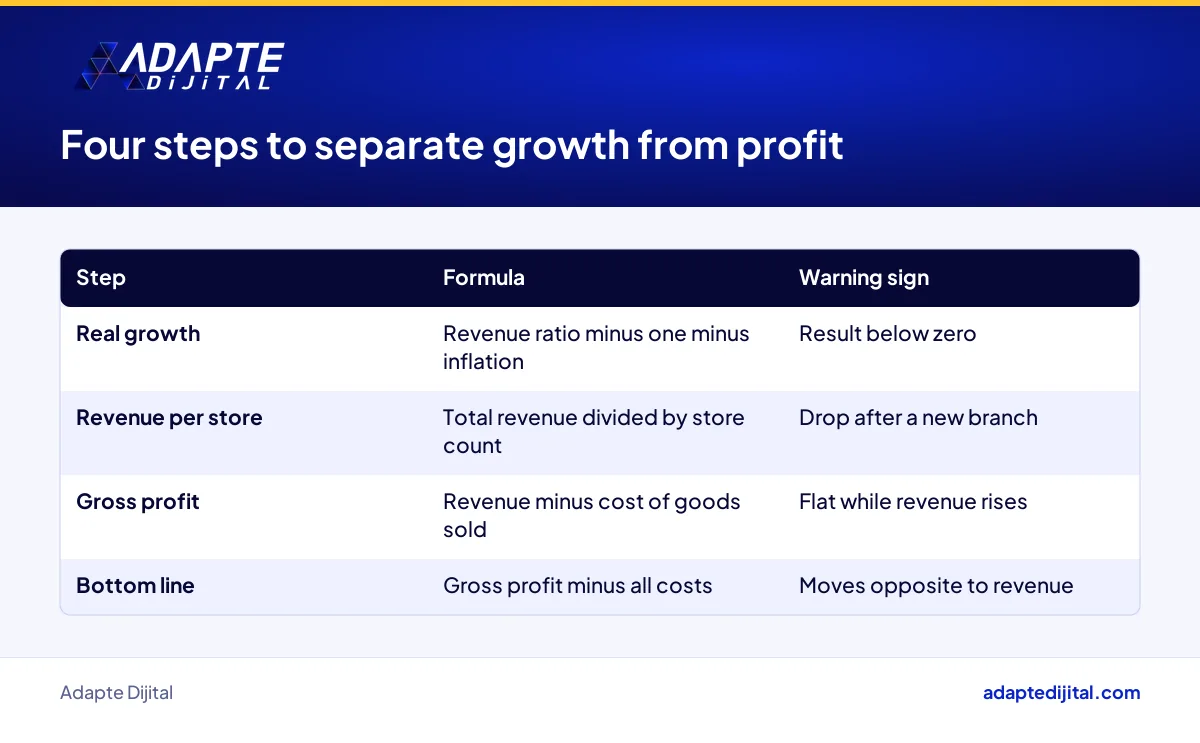
A four-step calculation does it. Each step has a formula for your own numbers; there are no sample figures, because cost structures differ. Do the calculation monthly and compare it with the same month last year. With high inflation, looking only at nominal revenue can leave you shrinking while you think you are growing.
Step 1: Calculate real growth
Formula: this month’s revenue divided by revenue in the same month last year, minus one, minus inflation for the same period. If the result is below zero, you are actually shrinking, even though the till keeps ringing.
Step 2: Find revenue per store
Formula: total revenue divided by the number of stores. If you have one store, use sales per square metre: revenue divided by selling space. If this figure drops after you open a new branch, your growth is inefficient.
Step 3: Put gross profit in the same table as revenue
Formula: revenue minus cost of goods sold. Write this figure next to revenue. If revenue rises while gross profit stays flat, you are selling on discount or failing to pass cost increases on to prices.
Most common mistake: Taking revenue for profit
Small businesses most often confuse the till total with the money left at month end. Any reading before rent, wages and card fees misleads you. If the till is busy but nothing stays in your pocket, the problem is cost, not sales.
How does ŞOK Marketler’s growth model affect other retailers?
Corner shops and independent grocers feel the most pressure, as new-concept stores offer a modern alternative on the same street. Food suppliers making private-label products may gain; 13 of the chain’s own-brand products were included in the International Taste Institute 2026 Superior Taste Awards. Other discount and regional chains are pulled indirectly into the concept and loyalty race.
What do the Cepte ŞOK app and Win loyalty programme change on the digital side?
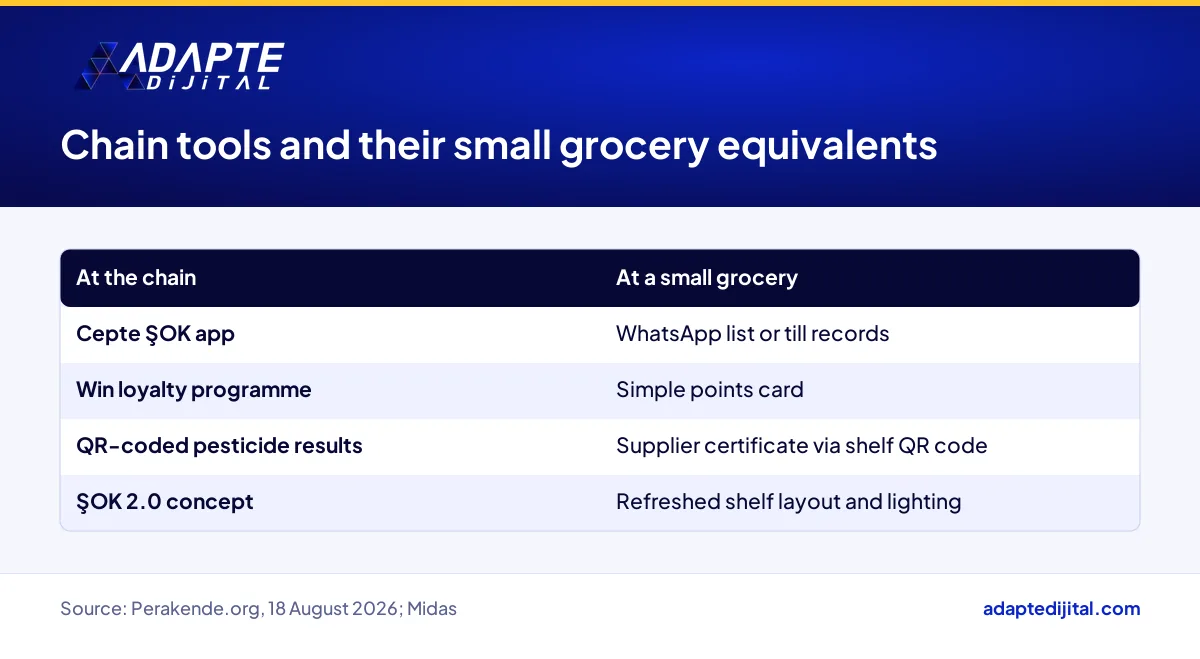
They change how the chain knows its shoppers and brings them back. According to Midas, the Cepte ŞOK app and the Win loyalty programme are among the company’s strategic priorities. Price gaps close quickly in discount retail; an app and loyalty scheme tie the next trip to the same store. A small retailer can also start digital loyalty without a big budget.
What should a grocer do with the revenue and profit table this week, after the ŞOK results?
BU BÖLÜMÜN ÖZETİ
- Monday: Gather the last three months of numbers
- Wednesday: Check stock turnover
- Friday: Complete the template
Build one table this week and fill in the last three months. It has five rows: revenue, cost of goods sold, rent and staff, card fees and other costs, and the bottom line. Check whether revenue and the bottom line move in the same direction. We set up digital channels and measurement with businesses through our digital consulting.
Monday: Gather the last three months of numbers
Gather till reports, invoices and bank statements. Leave a missing line blank and note it rather than guessing.
Wednesday: Check stock turnover
Formula: cost of goods sold divided by average stock. Low turnover shows stock sitting on the shelf and tying up cash. List your five slowest-moving products.
Friday: Complete the template
Checklist template: is real growth above zero, is revenue per store or per square metre falling, does gross profit rise with revenue, where does your repeat customer rate stand, is the bottom line positive. Write yes or no next to each question; every no is next week’s job.
Quick Summary
- ŞOK Marketler’s first-half 2026 revenue is TL 167.8 billion, with real sales growth of 7% (Perakende.org, 18 August 2026).
- According to KAP data reported by Midas, the first-half net loss is about TL 1.35 billion, against TL 954.8 million a year earlier.
- The company has 11,175 stores and 52,790 employees (Perakende.org).
- Pesticide test results for fruit and vegetables are shared with shoppers through a QR code (Perakende.org).
- The deadline for third-quarter results is 9 November 2026 (ŞOK Investor Relations).
Short Glossary
- Real growth
- Real growth is the measure used to show the increase in revenue after the effect of inflation is removed.
- Sales per square metre
- Sales per square metre is the indicator used to measure how much revenue each square metre of a store’s selling space produces.
- Stock turnover
- Stock turnover is the ratio used to show how many times the goods on the shelf and in the stockroom are sold and replaced in a given period.
Frequently Asked Questions
Next Step
If you would like to build your revenue and profit table together, fill in the consult your expert form and we will get back to you on measurement and digital loyalty.
Sources: Perakende.org, “ŞOK Marketler’in cirosu yılın ilk yarısında 167,8 milyar TL’ye ulaştı” (ŞOK Marketler’s first-half revenue reaches TL 167.8 billion), 18 August 2026 · Midas, report on net loss and strategy based on the KAP filing, 17 August 2026 · ŞOK Marketler Investor Relations financial calendar.
Updated: October 2026
Sık Sorulan Sorular
Revenue shows total sales through the till. It does not show the cost of goods, rent, staff or financing costs. TL 167.8 billion measures scale, not profit.
The Perakende.org story focuses on revenue, stores and private label; the loss figure comes from Midas’s report based on the KAP filing. Reading a story from one source means seeing half the picture.
The company’s investor relations financial calendar lists 17 August 2026 for the second-quarter announcement. The deadline for third-quarter results is 9 November 2026.
Every new store adds to revenue. But a new store may not cover its own costs in its first months. The story does not say how many stores opened net in the first half, so how much of the growth comes from new stores is unknown.
The company is growing with a new store concept called ŞOK 2.0. CEO Uğur Demirel describes it as offering “a more modern, comfortable and richer shopping experience.” A refresh draws shoppers, but it also needs spending on shelving, lighting and fit-out.
With 52,790 employees, staff costs are clearly a large line. If revenue growth falls behind the rise in staff costs, profit melts away even as sales grow.
A concept store opening next door offers wider shelves and app promotions. The corner shop’s edge is a familiar face and fast service; left unmeasured, that edge fades and shoppers turn around at the door.
Award-winning own-brand products support the chain’s quality claim. A producer who can name its product’s difference finds room on a chain’s shelf; we look at the export version of that in our piece on Dardanel and Walmart Canada.
Adding locations raises the same question in every sector: does each new site add to profit? We explain what building growth on central operation changes in our look at Coffee Factory’s five-country target.
The company runs lab pesticide tests on fruit and vegetables before they reach the shelf and shares the results with shoppers through a QR code. A small grocer can likewise show a supplier’s certificate on the shelf with a QR code.
Formula: customers who came back a second time in the month divided by total customers. Track this ratio with a WhatsApp list, a simple points card or the customer records in your till software.
Without current hours and products on the Google Business Profile, a nearby shopper goes elsewhere. The profile is a neighbourhood grocer’s digital shop window; we also collect local visibility examples on our retail page, where we interpret the retail agenda for you.
If sales income does not cover the cost of goods, rent, staff and financing costs, a loss appears even as revenue rises. Tracking revenue and the bottom line in the same table shows the gap.
Divide this month’s revenue by the same month last year, subtract one and then subtract inflation for the same period. If the result is below zero, you are actually shrinking.
Set up a simple record that lets you know your customers and measure how many come back a second time. Make your familiar face and fast service visible in local search and on the shelf.