
MediaMarkt July data puts fans in the top three in 4 provinces, how to plan stock by city?
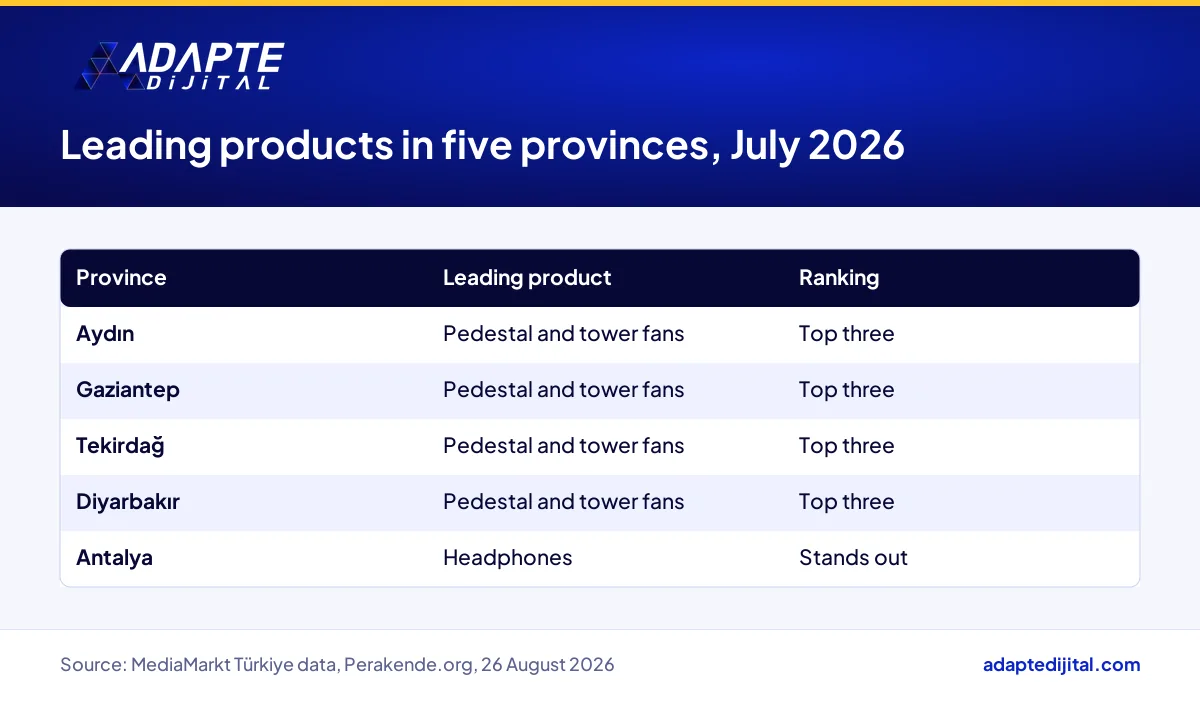
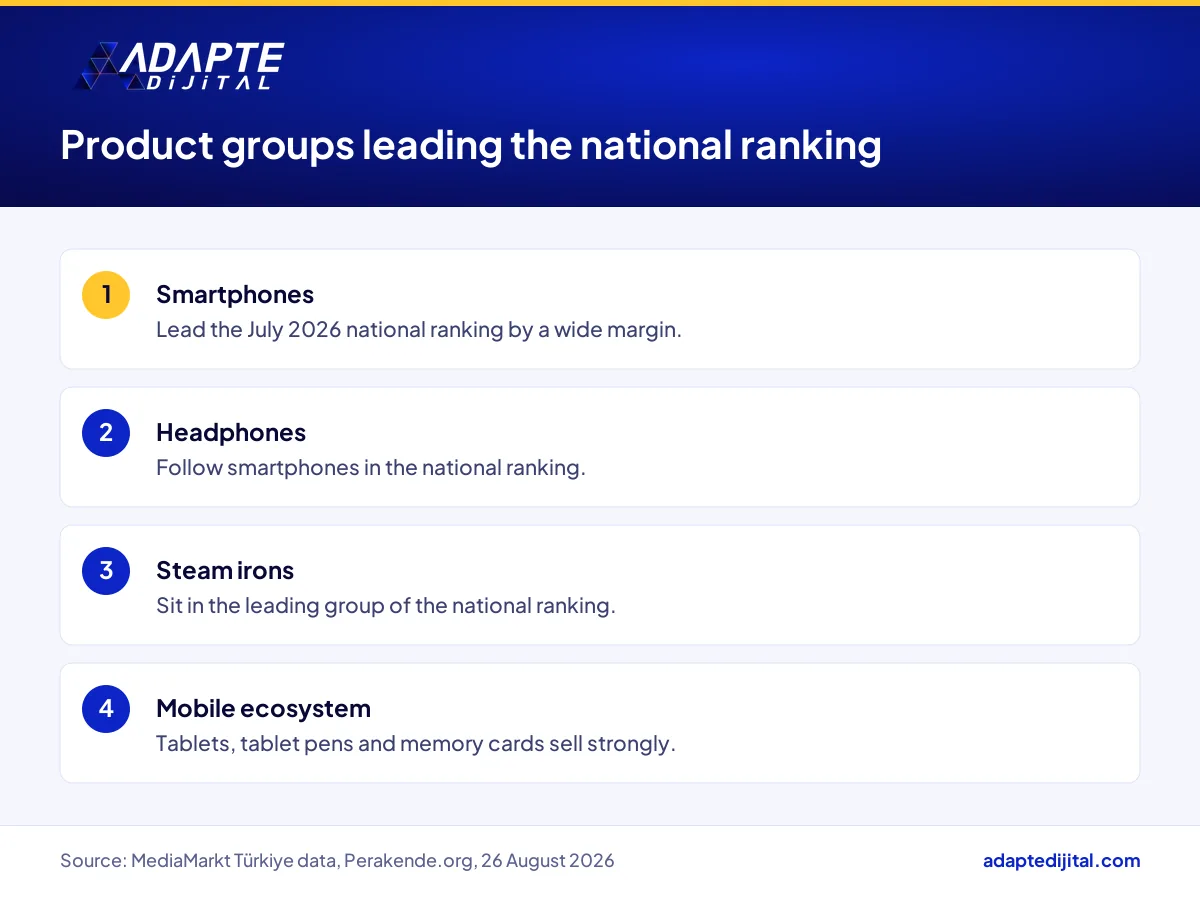
Smartphones lead MediaMarkt Türkiye’s July 2026 city-level sales data by a wide margin, followed by headphones and steam irons, while pedestal and tower fans make the top three in Aydın, Gaziantep, Tekirdağ and Diyarbakır (Perakende.org, 26 August 2026). In Antalya, headphones stand out. Tablets, tablet pens and memory cards also sell strongly.
What it means for you: same month, same chain, different province, different shelf. A retailer that sets stock and campaigns by the national average can miss the product its own region actually wants. The data covers one summer month; read in October 2026, its value lies in building next season’s stock calendar now.
What exactly does MediaMarkt’s July 2026 provincial data show?
It shows that demand in Turkish technology retail splits by province. Smartphones, headphones and steam irons sit at the top of the national ranking. In five provinces the picture changes: fans lead in four, headphones in Antalya. The report also says toasters, water dispensers, surge-protected power strips and rechargeable toothbrushes stand out in some cities, but it does not name those cities.
When does the fan’s top-three spot in four provinces matter for your stock calendar?
It matters before the next hot season’s order goes in. Seasonal products like fans have a short selling window, while supply is planned well ahead. If a product that made the July top three in a province is not on the shelf there in early summer, the customer walks to another door. Reading this data in October is not late; it is the right time to catch the ordering calendar.
Which retailers does regional demand in MediaMarkt’s data affect, and how?
It hits regional electronics and small appliance stores that sell seasonal products the hardest. An independent dealer in a hot province who follows the national campaign calendar misses the window for fans. A store in a province like Antalya, where headphones lead, sees a different basket altogether. A marketplace seller can already track demand by delivery region in its panel.
How should a local retailer read provincial sales data like MediaMarkt’s?
Read your own data first, then the national data. A national ranking is a compass: it gives direction but does not show your street. In summer 2026, Turkish technology stores sell different products in different provinces in the same month. The first job is to split your own sales records by product group, month and branch.
How does provincial demand data like MediaMarkt’s translate into web, search and ads?
It shows up in location-targeted ads, local search visibility and product page ranking. A product with rising demand in a province can move up in that province’s ad budget and in your website’s showcase slots. Showing in-stock seasonal products on your map listing and business profile makes your store visible in searches like “fan near me”.
What should technology and small appliance retailers do about stock this week, given MediaMarkt’s data?
BU BÖLÜMÜN ÖZETİ
- Pull summer sales by product group and branch
- Count the stock left at season’s end
- Put ad and stock data in one table
This week, split your summer data by province and product group, and draft your seasonal order from it. A separate list per branch or region, instead of one uniform order, decides whether next summer’s shelf is empty or overloaded. By the end of the week you should have one table broken down by product group, province and month.
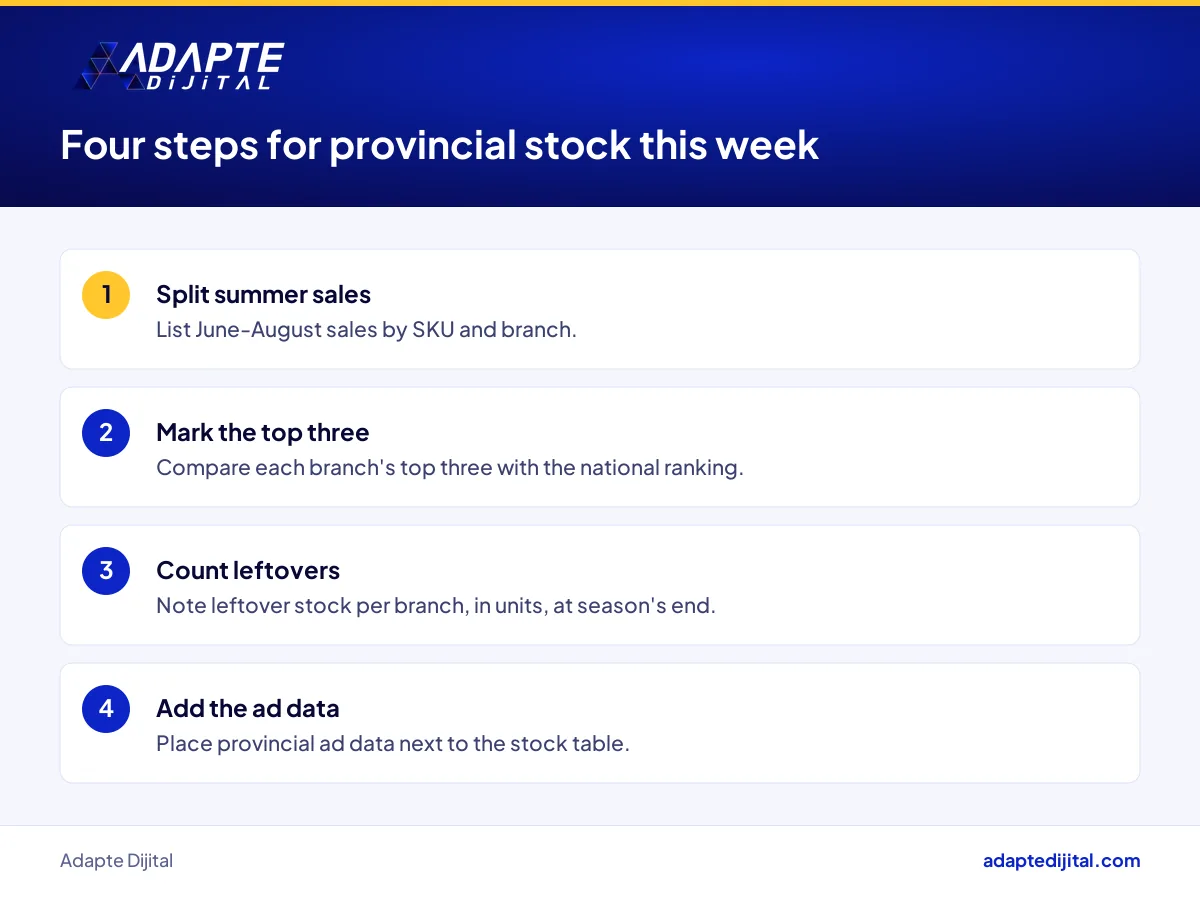
Pull summer sales by product group and branch
List June, July and August sales at SKU level, by branch or delivery province. Mark each branch’s top three products. Products that depart from the national ranking are your regional stock signal.
Count the stock left at season’s end
Note, in units, which product was left over at which branch. If a product sold out in one branch and sits on the shelf in another, the problem is distribution, not demand.
Put ad and stock data in one table
Pull clicks and sales by province from your ad panel and place them next to the stock table. When both tables point to the same product, the signal is strong. We set this up with clients as part of our e-commerce consulting, reading sales and stock data together.
If you want the same data habit on the customer side, our piece on silent churn and lapsed customers shows how to spot shoppers who quietly drift away. And if you are choosing where to open a new branch, our take on Onur Market’s new store in Maslak looks at the same question from the store side.
Quick Summary
- Smartphones lead MediaMarkt Türkiye’s July 2026 national sales ranking (Perakende.org, 26 August 2026).
- Fans make the top three in Aydın, Gaziantep, Tekirdağ and Diyarbakır, while headphones stand out in Antalya (Perakende.org).
- The data does not say whether it counts units or revenue, or whether online sales are included.
- TÜİK data shows Turkish retail sales volume up 10.4% year on year in July 2026 (CNBC-e, 11 September 2026).
- The lesson for a local retailer is to build seasonal orders on its own provincial data, not the national average.
Short Glossary
- Stock turnover
- Stock turnover is the ratio used to measure how many times shelf stock sells and is replenished within a period.
- SKU
- SKU is the stock code used to track each product variant separately by colour, model and size.
- Seasonal product
- Seasonal product is the term used for goods whose demand clusters in certain weeks of the year, with a short selling window.
Frequently Asked Questions
Next Step
If you want to read your sales, stock and ad data together by province, fill in the consult your expert form and we will build the first table with you.
Sources: Perakende.org, 26 August 2026 · MediaMarkt Türkiye, About Us · Yeni Birlik, 22 July 2026 · TÜİK data via CNBC-e, 11 September 2026. You can also visit our retail page, where we interpret the retail agenda for you.
Updated: October 2026
Sık Sorulan Sorular
The data comes from MediaMarkt Türkiye’s city-level sales records and covers July 2026. The report carries no names, titles or quotes, and does not say why the company shared the data.
The report does not say whether the ranking is based on units or revenue. It does not say whether online sales are included. There are no percentages or unit counts by province, only a “top three” level. You get five example provinces, not a list for all 81, so building a “number one product in every province” table would be wrong.
A wide physical network makes provincial differences measurable. MediaMarkt Türkiye’s corporate page describes 102 stores in 32 provinces, 27 of them in İstanbul. A Yeni Birlik report on the chain’s June 2026 data gives the number as 104, so the store count depends on the source.
Stock that lands mid-season misses half the selling window. Whatever is left at the end of the season gets cleared at a discount, and the margin melts. Stock turnover drops and cartons wait in the warehouse until next summer.
In MediaMarkt’s June 2026 data, smartphones were also on top, and personal care technology stood out thanks to Father’s Day and summer (Yeni Birlik, 22 July 2026). In July, a seasonal product moves ahead in some provinces. Side by side, the two months show special days and weather shifting demand.
According to TÜİK, the Turkish Statistical Institute, retail sales volume rose 10.4% year on year and 0.2% month on month in July 2026 (CNBC-e, 11 September 2026). Demand is lively overall; where it flows only shows up in local data.
The independent dealer who knows the region and splits orders by provincial data wins. A store that sees headphone demand in Antalya or fan demand in Aydın early can give that product the shelf space.
Small chains that place one uniform order from head office struggle. Fans sell out in one province while the same model sits on the shelf in another. Moving stock between branches then eats into the profit margin.
Distributors and small appliance wholesalers feel it indirectly. If dealers start ordering by province, they have to split shipment plans by region.
Put your own top three next to the national top three. If they do not match, the gap may be your regional advantage.
Track both, separately. Units show what moves off the shelf; revenue shows what brings money to the till. A fan can leave high units and low revenue, a smartphone the opposite. The report skips this split, so make it in your own records.
Your own site’s search report shows which product people look for from which province. That signal arrives before the sale. If searches rise but sales do not follow, the product is either out of stock or hard to find on the page.
The delivery region report in your marketplace panel shows which provinces orders go to. For seasonal products, it helps you set warehouse and shipping plans by region.
In most businesses it does not. We often see ad budgets split by channel rather than by product. Splitting the budget by province and product brings better-matched customers for the same spend.
You do, but your provincial data is your own till. With one branch, a split by product and month is enough; if you sell on a marketplace, add the delivery province report.
It gives a general signal only for the five provinces named in the report. There are no units, percentages or a list for all 81 provinces; your own sales records are a more reliable source.
Before the season starts, in line with your supplier’s ordering calendar. Pulling last season’s sales and leftover stock data now lets you meet that calendar prepared.