
AYD’s mall index hit 5,990 points in May, how should store owners read the jump?
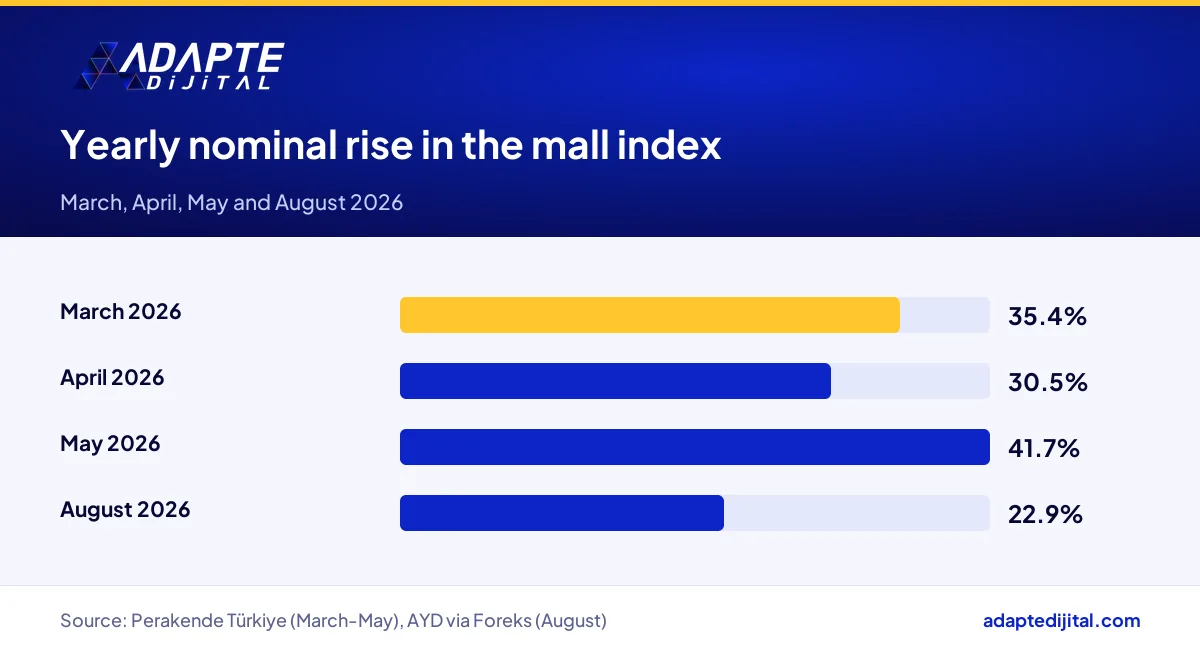
Sales per square metre in Turkish shopping malls reached 5,990 points on the AYD index in May 2026, a nominal rise of 41.7% year on year (Perakende Türkiye, 3 August 2026). AYD, Türkiye’s association of shopping mall operators and investors, publishes the index monthly with Akademetre Research. March came in at 5,184 points with a 35.4% rise, and April at 4,598 points with a 30.5% rise.
What it means for you: the May number looks bright, but one month is not a trend. According to Fintables, May’s real growth is 6.9%. By August 2026 the index drops to 5,392 points, nominal growth slows to 22.9% and real sales shrink by 6.5%. Base your rent and location decisions on several months of your own numbers, not on one headline.
What does AYD’s mall sales productivity index show for May 2026?
The index tracks how much revenue stores in an AVM, the Turkish term for a shopping mall, generate per square metre each month. May 2026 shows 5,990 points and a 41.7% nominal rise year on year. Fintables puts the month-on-month rise over April at 30.3%. The base year, the method and the number of malls covered are not in the report.
How much of the 41.7% rise in the mall index is left after inflation?
About 6.9% is left in May. Fintables calculates real growth at that level using 32.61% inflation. In other words, most of the headline rise is a price effect. In August, a 22.9% nominal rise turns into a 6.5% real contraction.
How does the May 2026 category split affect different mall stores?
Entertainment and hobby wins, with the highest rise at 74%. Technology and personal care also stay above inflation. Hypermarkets struggle: a 19.5% rise sits below 32.61% inflation, which means a real decline. Clothing lands in the middle, and footwear only just clears inflation, so it is roughly flat in real terms.
| Category | May nominal rise | Who should read it how |
|---|---|---|
| Entertainment and hobby | 74% | Toy, book and play-area businesses that rely on family footfall |
| Technology | 52.3% | Stores selling high-ticket items with a set promotion calendar |
| Personal care | 48% | Chains or independents selling cosmetics and care products |
| Food and beverage | 41.9% | Cafes and restaurants that depend on visitor flow |
| Clothing | 41.6% | Brands that manage season changes with product, not price |
| Footwear | 33.5% | Stores roughly flat in real terms that must watch margin |
| Hypermarket | 19.5% | Operators in real decline who should prepare for rent talks |
Source: Fintables July 2026 retail bulletin (AYD data). The entertainment and hobby figure also appears in Perakende Türkiye.
How can a store owner compare their own sales per square metre with AYD data?
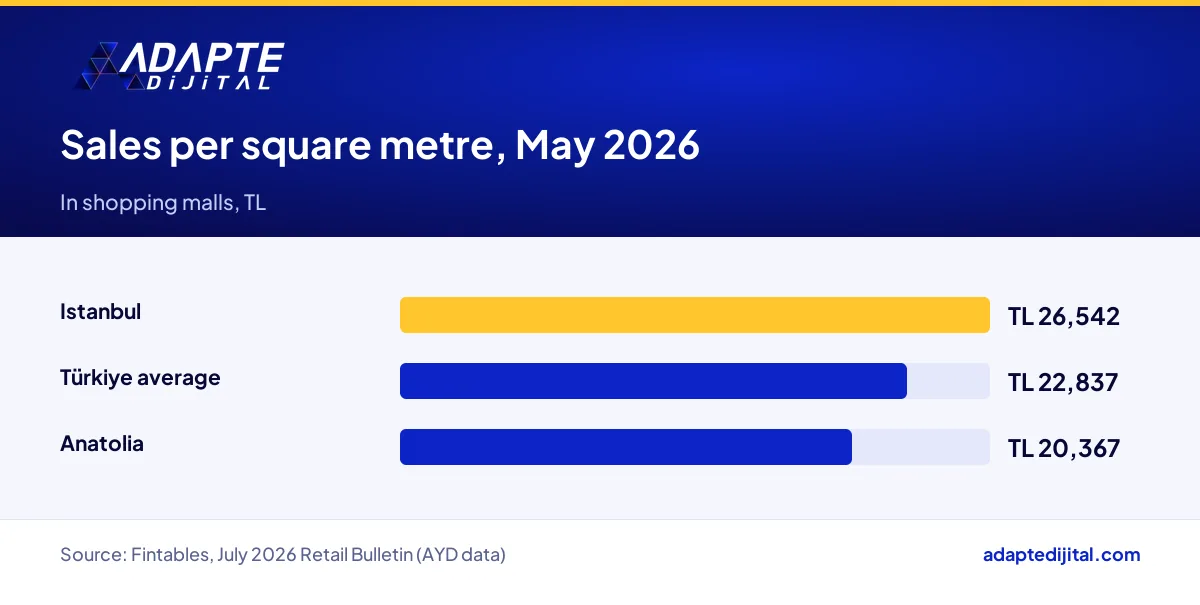
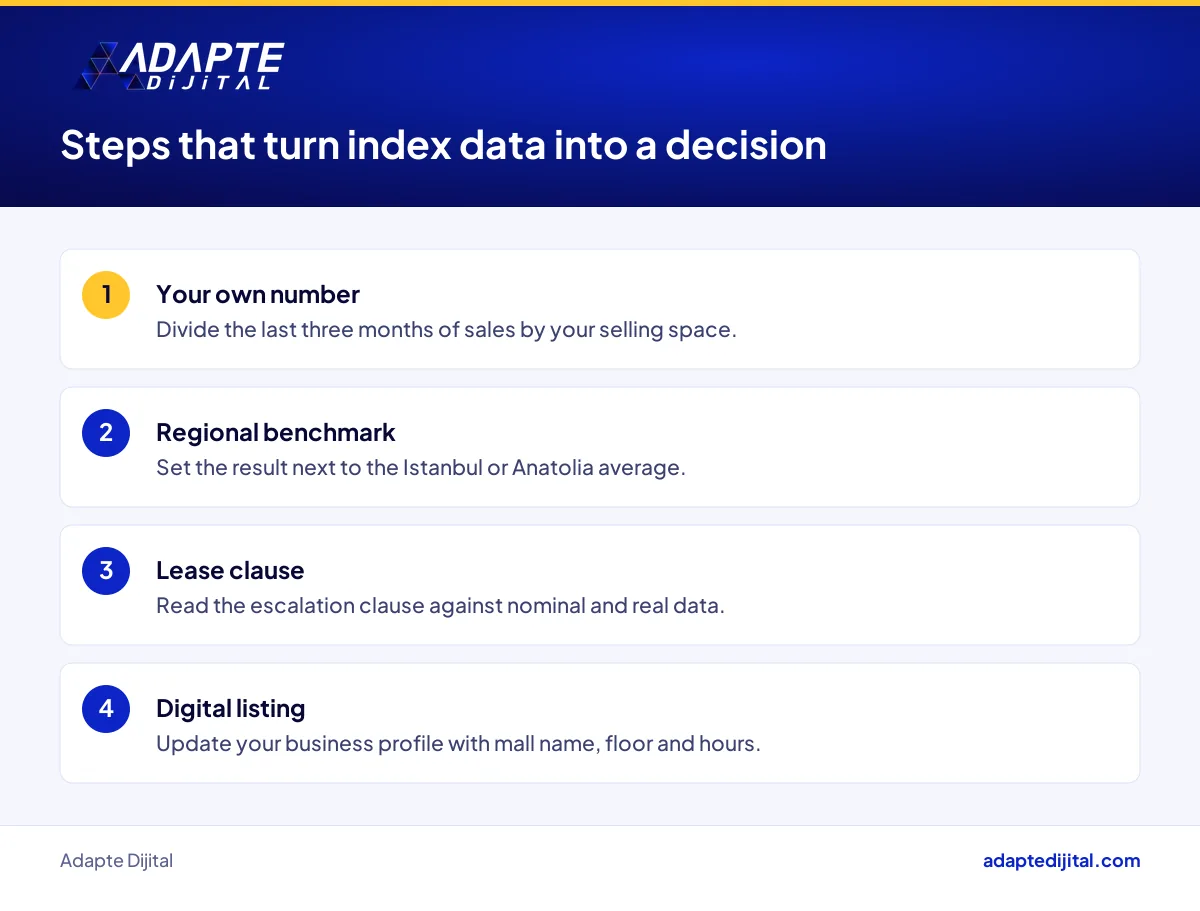
Start with simple arithmetic: divide your May sales by your selling space and set the result next to the regional average. According to Fintables, May sales per square metre are TL 26,542 in Istanbul, TL 20,367 in Anatolia and TL 22,837 on the Türkiye average. Because the index method is unknown, the comparison points a direction rather than delivering a verdict.
How does rising mall footfall show up on a store’s digital side?
A customer who searches a store name, opening hours or a product on the phone before heading to the mall takes the first step online. A 14.3% rise in the visitor index points to a period when those searches grow too. If your map listing, hours and stock information are out of date, part of that traffic goes to a competitor.
What should a mall store owner do this week with the AYD data?
Do three things this week: calculate sales per square metre for the last three months, read the escalation clause in your lease against both nominal and real data, and update your store’s digital listings. Turning data like this into a decision table is work we do under digital consulting.
You can find more data stories on our retail page, where we interpret the retail agenda for you.
Quick Summary
- The mall sales productivity index reaches 5,990 points in May 2026, a 41.7% nominal rise year on year (Perakende Türkiye).
- Real growth in May stays at 6.9% (Fintables).
- In August 2026 the index stands at 5,392 points with a 6.5% real contraction (AYD data via Foreks).
- In May the highest rise is 74% in entertainment and hobby and the lowest is 19.5% in hypermarkets (Fintables).
- May sales per square metre average TL 22,837 across Türkiye (Fintables).
Short Glossary
- Sales per square metre
- Sales per square metre is the indicator used to measure the revenue a store generates for each square metre of selling space.
- Real growth
- Real growth is the term used to express nominal growth after inflation has been stripped out.
- Rent-to-sales ratio
- Rent-to-sales ratio is the measure used to show a store’s rent as a share of its sales.
Frequently Asked Questions
Next Step
If you want to assess your store’s sales per square metre and rent balance together, fill in the consult your expert form.
Sources: Perakende Türkiye, 3 August 2026 · Fintables, Sectoral Outlook July 2026 Retail Bulletin (17 July 2026) · Foreks, report on the August 2026 mall index · Republic of Türkiye Ministry of Trade, Shopping Malls page.
Updated: October 2026
Sık Sorulan Sorular
Nominal growth runs at 35.4% in March, 30.5% in April and 41.7% in May. The series is not a straight line; it rises and falls month by month. That alone shows the risk of deciding anything from a single month’s headline.
Perakende Türkiye gives no reason. Fintables links the jump to Eid al-Adha, known in Türkiye as Kurban Bayramı, and that is a single-source reading. Holiday months and ordinary months do not belong in the same basket.
No. The report runs in August but describes May. As of October 2026 we also have August data, and the picture is different: 5,392 points, 22.9% nominal growth and a third month in a row of real contraction.
Mall management talks about nominal growth, while your profit comes from real growth. If rent climbs as fast as nominal sales, your rent-to-sales ratio worsens even when your real sales stand still.
It does not cancel it; it puts it in context. May is a strong month, while June, July and August show real contraction. That gives you data to push back if May is held up as the benchmark in autumn negotiations.
It is not. According to Fintables, the visitor index rises 14.3% year on year in May. The gap between visitor growth and sales growth shows how much of the rise comes from basket size and price.
The group covers gifts, toys, cinemas, children’s play areas, and books and magazines. In a month when families come to the mall together, these tills ring faster.
A rise below inflation means fewer goods sold in real terms. When sales per square metre fall in large-format tenants like these, a debate about the tenant mix can open up.
In March, personal care leads at 59%, technology follows at 58% and food and beverage at 47.2%. By May the lead moves to entertainment and hobby. Since the ranking changes from month to month, do not treat one month’s leader as permanent.
Sales per square metre in Istanbul are clearly higher than in Anatolia. But rent in Istanbul is high too. If you read sales without rent in a location decision, you get half the picture.
If your store is below average, first separate the cause. Is the space too large, is the product just sitting on the shelf, or are customers walking out empty-handed? Each one needs a different fix.
May carries a holiday effect, so it is not a benchmark on its own. Line up at least three months and compare your own sales with the same months.
Fill in the store’s business profile completely, including the mall name and floor. Update photos and promotions regularly, and reply to reviews.
Track till data weekly in the same sheet as map searches and web traffic. In weeks when conversion drops, the first place to look is often the search result, not the store.
Your own sales per square metre, your category’s May rise and the real contraction in August are the three strongest numbers on the table. Turkish malls fall under Law 6585 and the Shopping Malls Regulation, and you can see the framework on the Ministry of Trade’s shopping malls page. Verify with the official source; this is not legal or financial advice.
Study the target mall’s tenant mix and where your category sits in it. We cover a manufacturer’s decision to build its own store network in our piece on Mısırlı’s 111-store target, and protecting margins as sales slip in our piece on Mavi’s first quarter.
It does not. The index is an average, so do not draw conclusions until you calculate your own sales per square metre and compare the same months.
Mall management may use it, but May carries a holiday effect and August shows a real contraction. Go into the meeting with several months of data.
In the May data reported by Fintables, the Anatolia average is TL 20,367 per square metre. Since the method is unknown, use this figure as a rough reference.