
The Org Chart of an Agent Team: Which Desk Does Which Job in Our Own Line?
The org chart of an agent team is a drawing that shows at a glance which desks a job passes through, what each desk receives and what it hands over. In a human team you write down who reports to whom; in an agent team you write down who passes the work to whom. This is a lab report: we describe the chart of our own content line, as it runs today. 🗺️
Drawing the chart is not a one-off decoration. As the line grows, desks are added, some desks merge and some steps return to people. Below we describe our current chart, the rules we follow when drawing it and why the chart changed in recent weeks. Every change came from a real problem, and each one is described honestly.
Why does an agent team need an org chart?
BU BÖLÜMÜN ÖZETİ
- Making invisible work visible
- Explaining the system to a newcomer
- Planning change
An agent team works out of sight. Without a chart, nobody knows where a job is stuck or which desk changed what.
Making invisible work visible
An article looks finished on the screen, but five or six steps sit behind it. The chart puts those steps in order. When an error appears, the first question is “which desk did this happen at?”, and the chart answers it in seconds. Without a chart, the same question is answered by searching logs and can take hours. 👁️
Explaining the system to a newcomer
Someone joining the team learns from the chart how to work with the agents. A written chart removes the burden of explaining the same thing aloud every time. A system that cannot be explained stays dependent on one person, and that person becomes a bottleneck the day they are away.
Planning change
When a new step is wanted, the chart shows where it fits and which desk it affects. Change without a chart breaks a desk nobody expected. A minute spent thinking over the chart prevents an hour spent fixing afterwards, which is the best return on any planning tool we know. 🧩
Which desks are in our line?
BU BÖLÜMÜN ÖZETİ
- The data and topic desks
- The writing desk
- The measuring and packaging desks
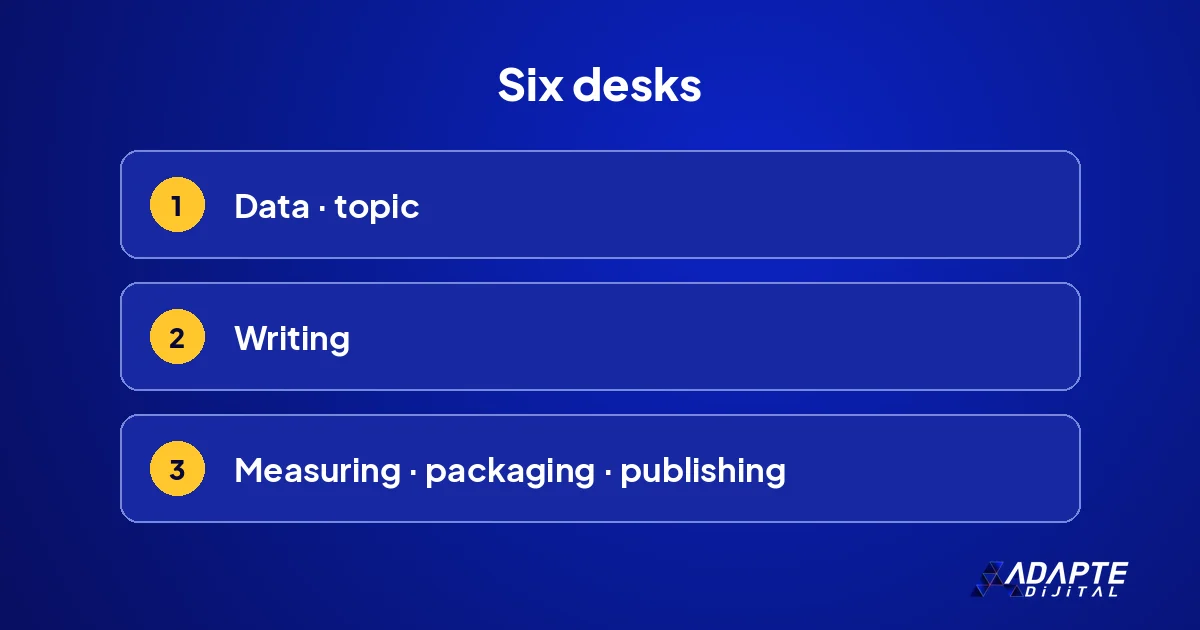
Our content line has six desks. We group them under three headings, each answering one question about the work.
The data and topic desks
The first desk reads search data: which page appears, for which query it ranks. The second compares the candidate topic with every article on the site; if the topic exists, no new article is opened and the existing one is improved instead. These two desks answer what to write. The topic desk scans hundreds of articles each week, which would take days by hand. 🔎
The writing desk
The writing desk writes the chosen topic on a fixed skeleton: introduction, six main sections, summary, glossary, frequently asked questions and next step. It reads the rules file, which holds the business model, the link counts and the source rules. Its work is creative, but its limits are written. However good its output, it cannot move forward without passing the measuring desk.
The measuring and packaging desks
The measuring desk is a script: it counts words, headings, links, sources and the similarity score, and sends any article that fails back to the writing desk. The packaging desk puts passing articles into one file with their images and covers. These two desks answer how the work is delivered. We walk through the line in how an agent content line works. 📦
Where do people stand on the chart?
BU BÖLÜMÜN ÖZETİ
- Direction
- Rules
- Publishing
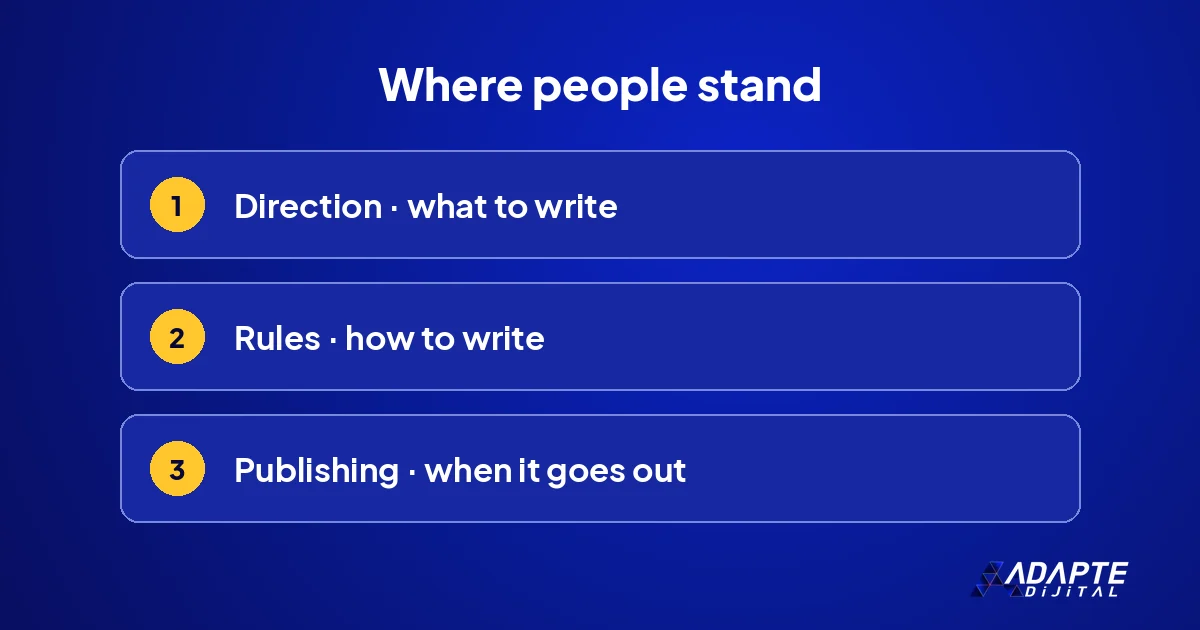
People stand at three points on the chart. Those points sit above the desks rather than between them.
Direction
A person decides which topics to enter and which to drop. For example, whether to start a whole group of topics now or wait for measurement is decided by the business owner. The desks carry that decision out; they do not question it. The decision is recorded in writing, so the desks know why they are working on a topic. 🧭
Rules
Only the rule owner changes the rules file. When the business model changed, the rules file was updated the same day and every desk moved to the new rule at once. Rules change in writing, not in conversation. Every change is dated, and the old version is never deleted, so any output can be traced to the rule that produced it.
Publishing
The package enters the site as drafts; the decision to publish belongs to a person and is made one article at a time. This is the slowest step on the chart, deliberately. The slow step is the irreversible step. How permissions are drawn around that step is covered in handover between agents and its companion articles. 🔘
Which rules did we follow when drawing the chart?
BU BÖLÜMÜN ÖZETİ
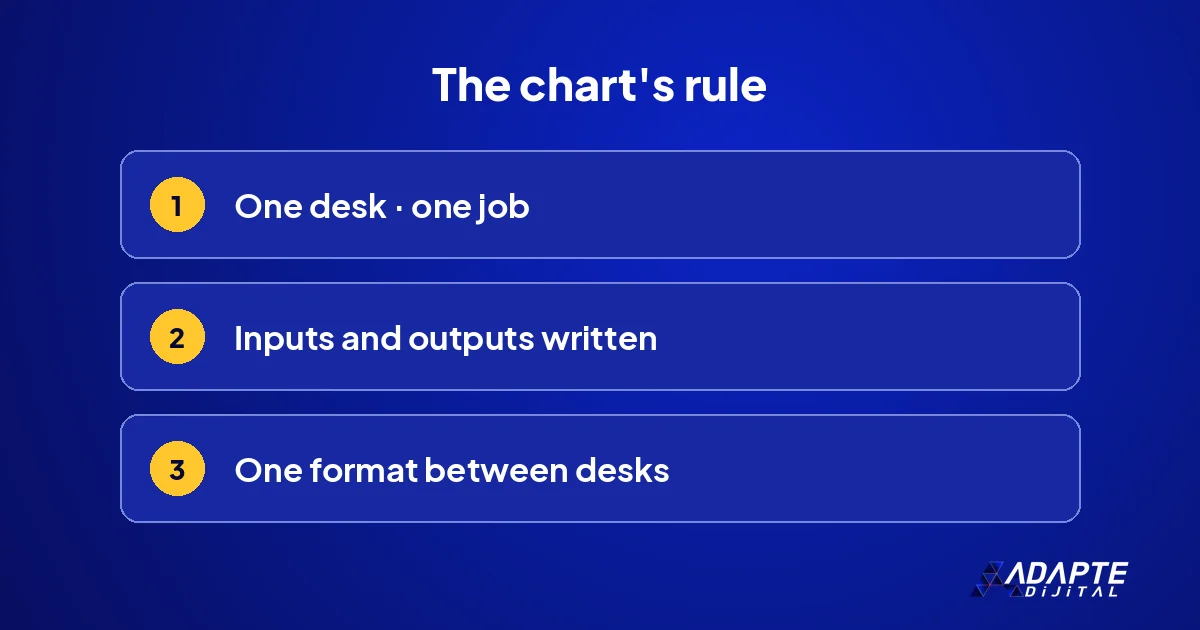
- One desk, one job
- Inputs and outputs written
- One format
The chart itself is subject to rules. Three of them keep it readable and changeable as the line grows.
One desk, one job
No desk does two jobs. The writing desk does not measure, the measuring desk does not correct. Separating jobs makes the source of an error easy to find; each desk’s errors stay at its own desk. When a desk needs a second job, a new desk is opened instead of overloading the old one. 🎯
Inputs and outputs written
What each desk receives and what it hands over is written in one line. One desk’s output must match the next desk’s input exactly. A connection that does not match is a broken point in the chart, and broken points are where most quiet errors live. These lines sit in a small table beside the chart.
One format
All handovers between desks use the same format: title, address, category, content, verification counts. A shared format makes adding a desk easy; the new desk only has to learn to read that format. What a person should never hand to any desk is covered in what you should never delegate to AI. 📐
How has the chart changed in recent weeks?
BU BÖLÜMÜN ÖZETİ
- The overlap scan moved earlier
- A business model rule was added
- The link-count gate tightened
The chart is a living document. In recent weeks we made three real changes, and each grew out of a problem.
The overlap scan moved earlier
Before writing began, we noticed that the topics of some planned articles were already covered on the site. Since then, the overlap scan has been a mandatory step at the topic desk and runs before the writing desk. An article prevented before it is written is the cheapest correction there is; where overlaps are found, the existing article is improved. 🧹
A business model rule was added
When the business moved from monthly management to a single delivery package, a binding line was added to the rules file and published articles were scanned against it. The rule changed every desk at once rather than one at a time. Changes to old articles were kept small and listed one by one.
The link-count gate tightened
The measuring desk began rejecting articles with more internal links than planned. Fixing the link count made every article’s links deliberate. How our earlier lines began is described in the three-month horizon. The chart itself is included in client deliveries, so it stays with the business. 🔗
How does Adapte Digital set this chart up for clients?
BU BÖLÜMÜN ÖZETİ
- A single delivery package
- The chart that is delivered
- Where to start
We adapt the chart of our own line to the client’s work; the desks change, the rules stay the same.
A single delivery package
Adapte Digital does not charge a monthly management fee. Work starts with a single delivery package whose scope is written down in advance: 36,000 TRY + VAT. If the work grows, the new need is defined as a separate add-on package, priced by what will be delivered rather than by the hours spent. 📦
The chart that is delivered
The output of the work is a desk chart drawn for the business’s own job, with an input–output definition for each desk. We choose together which job becomes the first chart, and the chart stays with you.
Where to start
Our current packages and capacity are listed on our campaign pages; scope and price are written there before any work starts. 🧭
If you want to offer this as a service, start with our article on outsourced agent management.
Quick Summary
- An agent team’s chart shows how work passes from desk to desk.
- Our line has data, topic, writing, measuring, packaging and publishing desks.
- People stand at direction, rules and publishing.
- One desk does one job; inputs and outputs are written.
- The chart is a living document; problems create new steps.
Short Glossary
- Desk
- A step in an agent team that does a single job.
- Input–output definition
- A written line showing what a desk receives and what it hands over.
- Rule owner
- The only person authorised to change the rules file.
Frequently Asked Questions
Next Step
Put the steps of one job you run with agents on paper: for each step, what it receives and what it hands over. That is your first chart.
Sources: DeepLearning.AI — Hermes Agent Challenges OpenClaw · Five Minute AI Brief — Open Source Agentic AI: A Practical Brief · WordPress Documentation — Roles and Capabilities
Updated: November 2026
Sık Sorulan Sorular
If there are more than two desks, yes. The chart shows where an error happened and explains the system to newcomers.
The tool does not matter; paper works. What matters is that each desk’s input and output are written.
Whenever a step is added or a problem calls for a new check. The date of each change is written on the chart.