
ECE Türkiye launches ECEConnect after 2 years of R&D, what do mall tenants gain from it?
ECE Türkiye has launched ECEConnect, a platform where mall tenants see their account statements, invoices and balances in real time, enter their sales directly into the system and compare their performance with anonymised sector and mall data (Perakende.org, 10 September 2026). The platform was built over two years of R&D with an investment of roughly 500,000 US dollars.
What it means for you: if you have a mall store, you can come to the rent table with data that puts your sales next to the mall and sector average, not just a gut feeling. In autumn 2026, with mall sales shrinking in real terms across Türkiye, that comparison may be the most solid ground you have in rent talks and store decisions.
What information does the ECEConnect tenant module give a mall store?
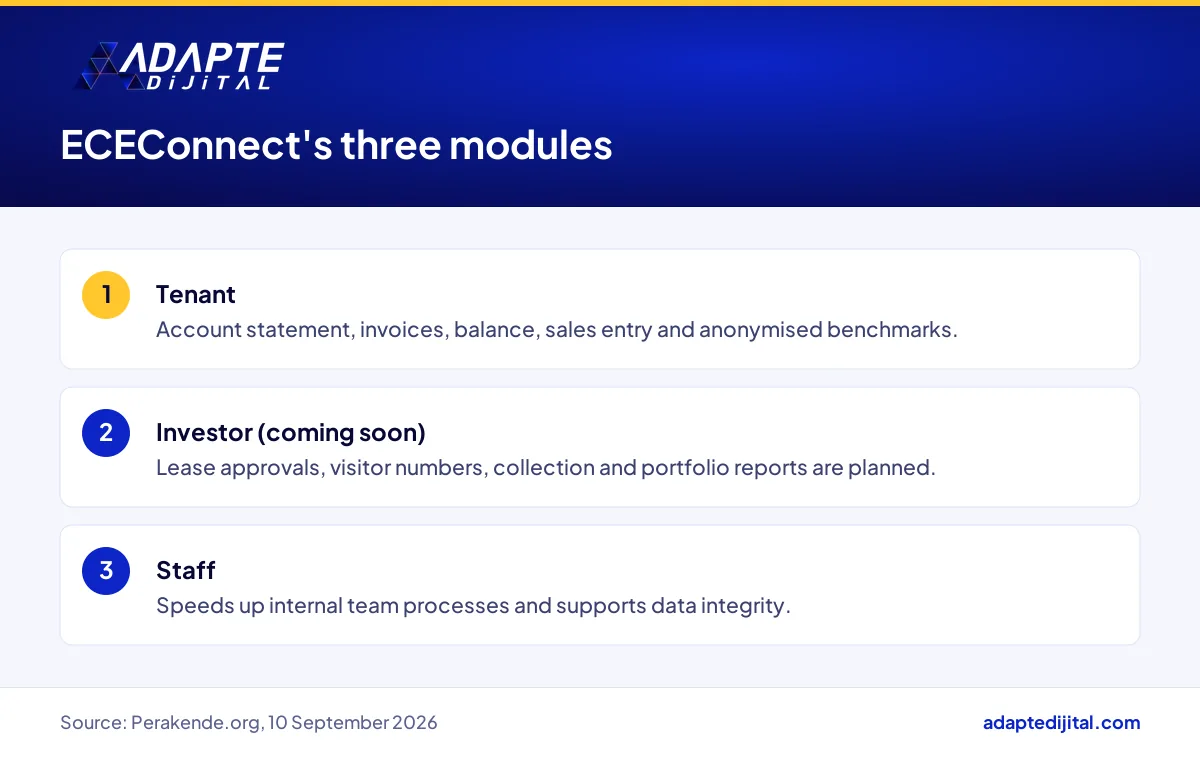
Three kinds: real-time financial records (statement, invoices, balance), direct sales entry and anonymised sector and mall benchmarks. Alongside the tenant module, the platform has Investor and Staff modules; the investor module is not live yet.
Why are mall sales in Türkiye rising in nominal terms but shrinking in real terms?
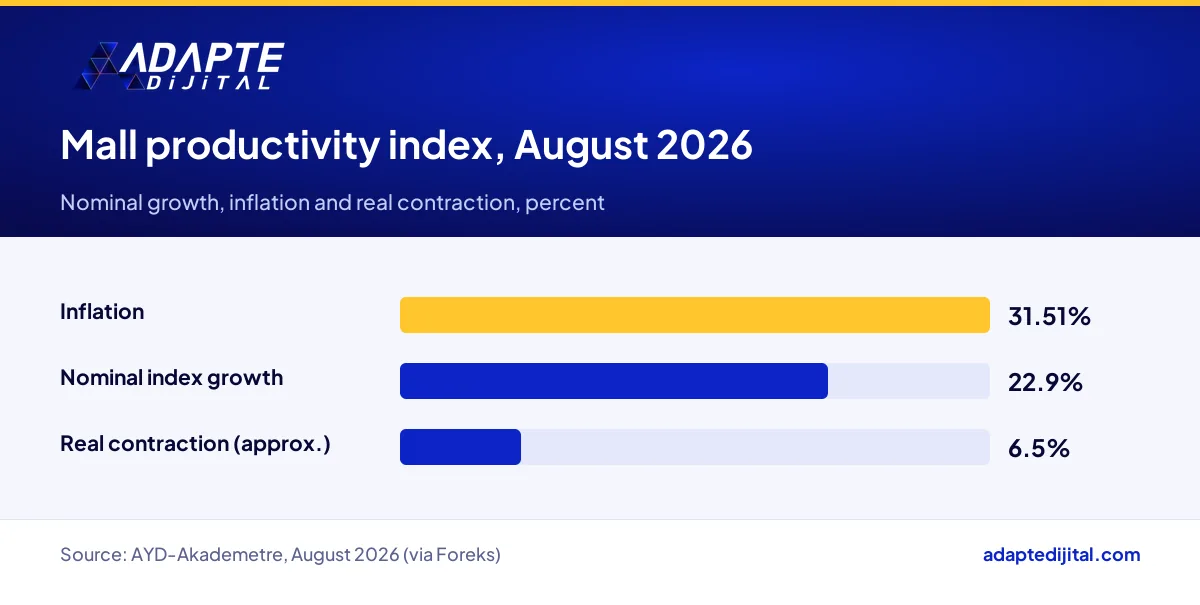
Because prices are rising faster than sales. According to AYD-Akademetre data, the mall sales-per-square-metre productivity index rose 22.9% in nominal terms in August 2026, reaching 5,392 points. With inflation at 31.51% over the same period, the real picture is a contraction of about 6.5%. The sales index has declined in real terms three months running.
How can a mall tenant use ECEConnect data in rent negotiations?
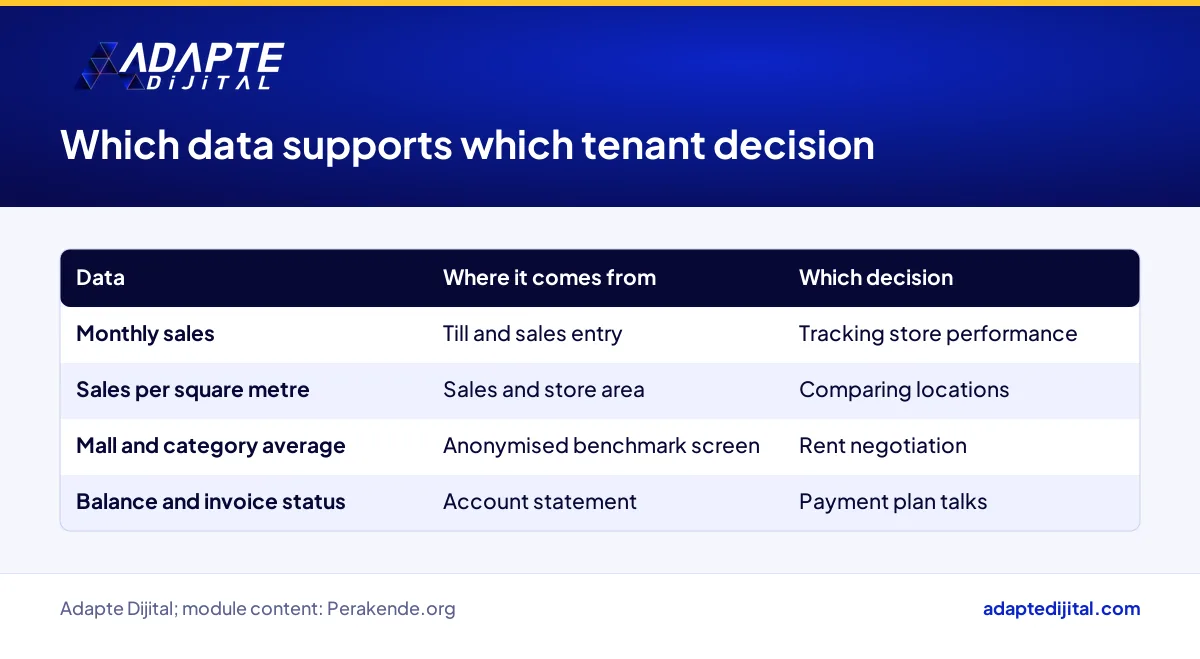
In three steps: first work out your own sales per square metre, then compare it with the mall and category average, and finally explain the gap from inside your store. The strong card is the explanation behind the number. The coverage does not say how often the benchmark data is updated, so confirm that on the platform.
Which tenants and businesses does ECEConnect affect, and how?
Chain stores and mid-sized brands that already keep tidy sales records gain the most, because they can turn the data into a benchmark right away. Single-store tenants who report sales by hand and late will find it harder. Indirectly affected are mall management teams, investors and the accounting firms that serve tenants.
How should ECEConnect tenant data be read together with a store’s web and local visibility?
Till data tells you about the inside of the store; digital data tells you about the outside. A drop in mall sales can also be linked to a store that is hard to find online, wrong opening hours or a weak review profile. Reading both together separates a footfall problem from a visibility problem.
What should a mall tenant do with ECEConnect-style benchmark data this week?
Three jobs fit into this week: gather the last six months of sales in one table, ask mall management about access to benchmark data and put your lease renewal date in the calendar. The coverage does not say whether the platform is paid or mandatory for tenants, so clear that up when you talk to management.
Now you know: for a tenant, ECEConnect’s value lies not in the investment figure but in seeing your sales next to the average, the firmest ground at the rent table in a period of real contraction. We collect similar developments on our retail page, where we interpret the retail agenda for you.
Quick Summary
- ECE Türkiye launched ECEConnect with Tenant, Investor and Staff modules (Perakende.org, 10 September 2026).
- The platform was built over two years of R&D with roughly 500,000 US dollars of investment (Perakende.org).
- Tenants can enter sales and compare their performance with anonymised mall and sector data.
- The mall productivity index rose 22.9% in nominal terms in August 2026 but shrank about 6.5% in real terms (AYD-Akademetre).
- Benchmark data gives tenants measurable ground in rent talks and store decisions.
Short Glossary
- Sales per square metre
- Sales per square metre is the measure used to compare the productivity of stores of different sizes, calculated as sales divided by floor area.
- Anonymised benchmark data
- Anonymised benchmark data is the data used to compare a store’s performance with an average without naming any other store.
- Ageing report
- An ageing report is the table used to show how long receivables have gone unpaid, grouped by day ranges.
Frequently Asked Questions
Next Step
If you want to read your sales, rent and digital visibility data in one table, fill in the consult your expert form and we will look at your store’s situation together.
Sources: Perakende.org, 10 September 2026 · ECE Group corporate website · AYD-Akademetre Mall Sales Productivity Index, August 2026 (as reported by Foreks)
Updated: October 2026
Sık Sorulan Sorular
An account statement is the full list of charges and payments between the tenant and mall management. Seeing it in real time means you no longer wait for an end-of-month email from accounts. Invoice disputes and payment-plan talks get shorter when the numbers are already on screen.
When sales are entered straight into the platform, the same figure stops passing from spreadsheet to spreadsheet. And correctly entered sales are the foundation of the next step, the benchmark.
An anonymised benchmark puts your sales next to averages built without naming any other store. You do not see what your neighbour sells; you see how your category and the mall are doing overall. ECE Türkiye General Manager Semet Yolaç Canlıel describes it, in our translation, as “ECEConnect, which we launched after two years of R&D”.
Nominal sales are the lira that go into the till; real sales are those lira with inflation stripped out. A nominal increase is like stepping on the bathroom scale in your winter coat: the needle goes up, but it is the coat that got heavier, not you.
Here’s something most people don’t know: because the till figure keeps climbing, many stores assume business is fine, yet the index has shown a real decline across malls for three straight months. Scale is part of the picture too. The ECE group states on its corporate website that it manages around 200 shopping centres in Europe and describes itself as the European market leader.
Sales per square metre is monthly sales divided by store area, and it lets you weigh stores of different sizes on the same scale. Track it monthly to see the seasonal wave. One bad month is not an alarm; a run of declines means the till isn’t ringing.
Below average, the problem may sit inside your store, not in footfall: window, layout, staff or price. If you are above average and the rent burden is heavy, that is also data worth putting on the table.
Put the last six months of sales, the gap to the mall average and the reason for that gap on one page. Tie your request to the numbers: a discount, stepped rent or a change of unit. Verify with the official source; this is not legal or financial advice, so check contract terms with your lawyer.
A brand in several malls can compare each location with its mall average and spot the genuinely weak store. That moves closure or downsizing decisions from instinct to data. It also gives a clearer read of where its category sits in the tenant mix.
For a business that totals sales from a notebook at month end, a new system looks like extra work, yet irregular entries paint the wrong benchmark picture. Telling whether customers are walking out the door or average basket size is falling depends on tidy till records.
The investor module is said to be coming soon, with no firm date. Planned content includes lease approvals, mall visitor numbers, ageing reports, collection rates and portfolio performance. An ageing report is a table that shows how long receivables have gone unpaid, grouped by day ranges.
The platform is built on Microsoft Dynamics 365 Business Central, with Apekta as the solution partner. For a tenant, the practical point is simple. Statements, invoices and sales entry sit on one platform instead of being scattered across emails.
Customers look up a store on maps and in search before they come to the mall. If your business profile has the wrong mall name, floor or hours, you see the loss at the till but not its cause. We look at the role of product data in AI assistants in our piece on Migros’s MAYA AI move.
Yes. A grocery or deli tenant that sits below its category average can review its range when items are just sitting on the shelf. We discuss standing out with niche products in our piece on FİLE Market’s gluten-free Harras range.
Ask management whether your ECEConnect account is open and whether you can see the benchmark screen. In the first month, just enter sales regularly; the comparison starts to mean something after the second month. Copy the results into your own table.
Ask your own mall management for a similar anonymised category average. If no such data exists, compare across your own stores or across years. We also build single dashboards for sales and rent records as part of our digital transformation management work.
ECEConnect is ECE Türkiye’s own platform, aimed at tenants in the malls it manages. The coverage does not say which malls it is live in, or whether use is paid or mandatory.
No. The data is anonymised and shows sector and mall averages without store names. You only see your own performance next to those averages.
No, it guarantees nothing. It helps you tie your request to measurable evidence; for contract terms you need legal advice.